

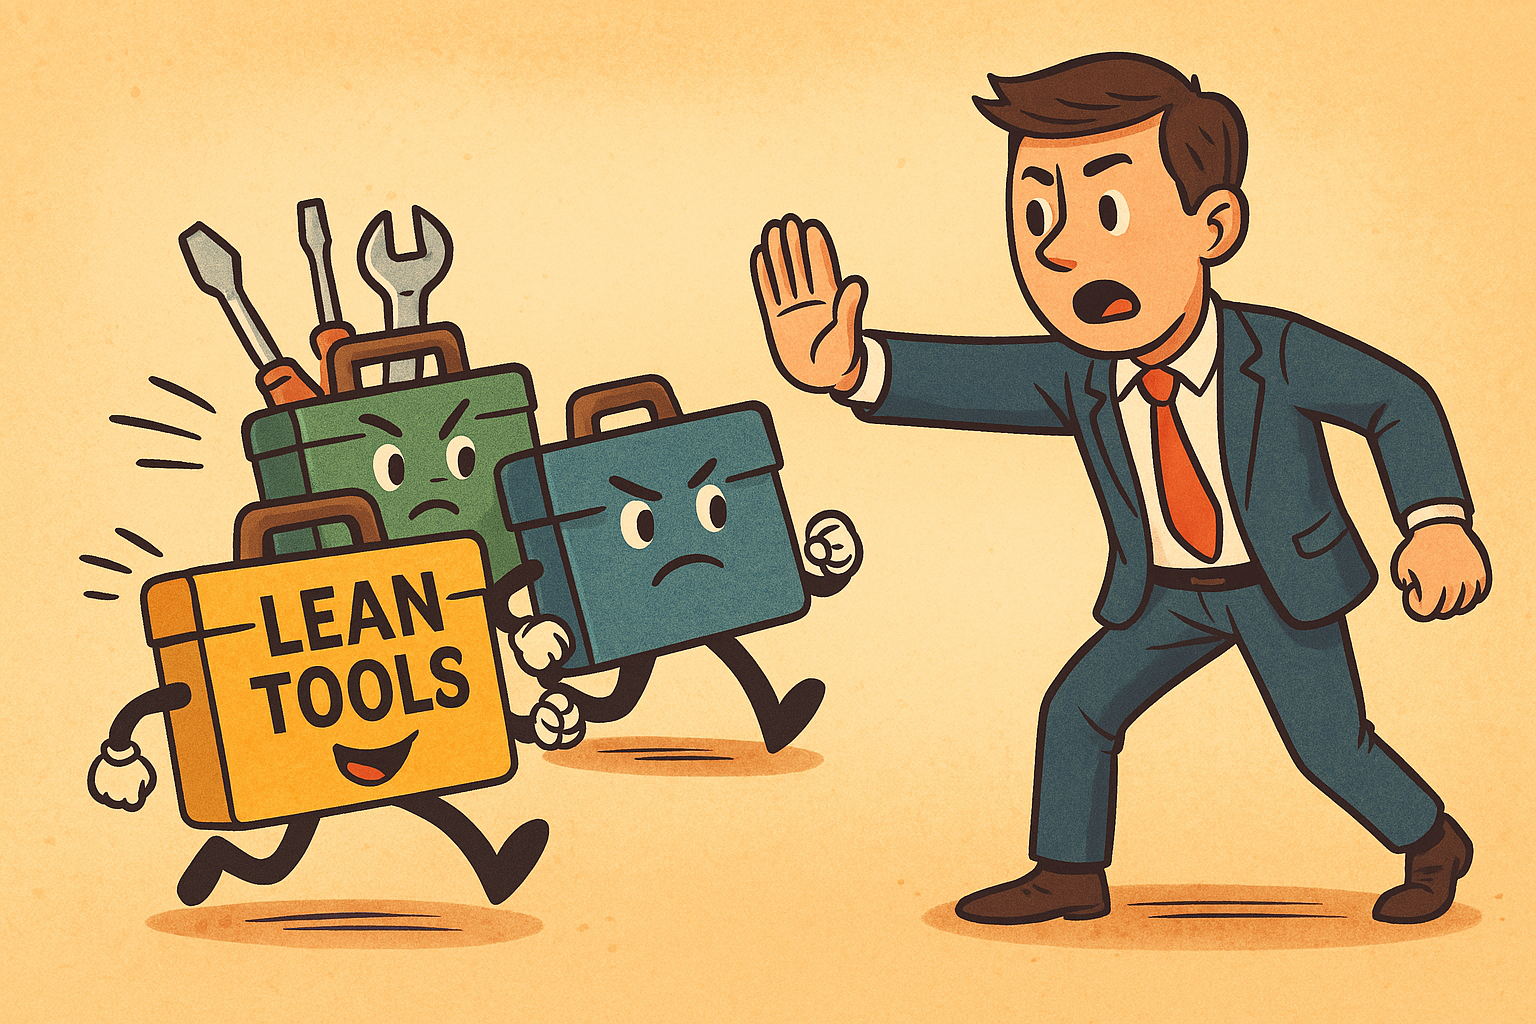
Stop using Lean Toolkits Willy Nilly!
To support a successful Lean journey, it’s important to be intentional and focused in how tools are applied. Introducing toolkits without a clear connection to real problems may create unnecessary challenges and resistance throughout the process. It will help your lean journey when you are consistent and direction-focused!
Core Lean principles are essential building blocks of a sustainable improvement culture and are a non-negotiable when changing to a lean culture:
Waste identification;
5S;
Standardisation;
Just-In-Time and;
Continuous improvement.
Everything else is amazing to implement but use them wisely! Large changes are daunting, but absolutely necessary!
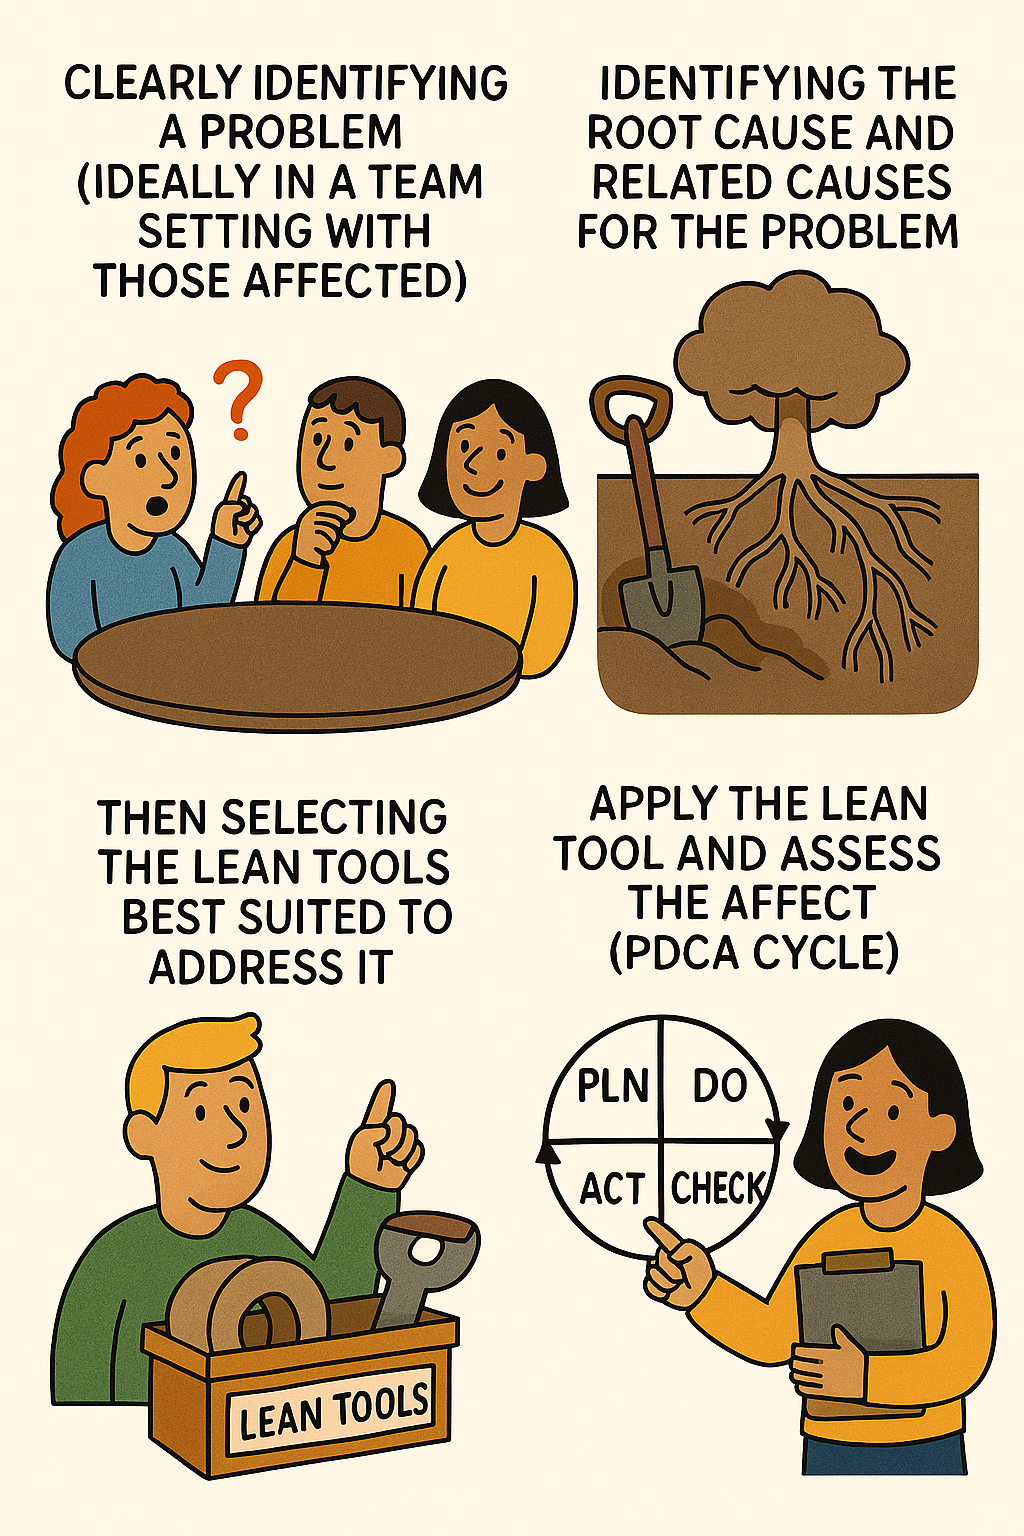
The most effective approach to all situations must be:
Clearly identifying a problem (ideally in a team setting with those affected)
Identifying the root cause and related causes for the problem
Then selecting the Lean tools best suited to address it.
Apply the lean tool and assess the affect (PDCA cycle)
Engaging your team from the outset ensures they feel ownership and become active participants in driving meaningful change.
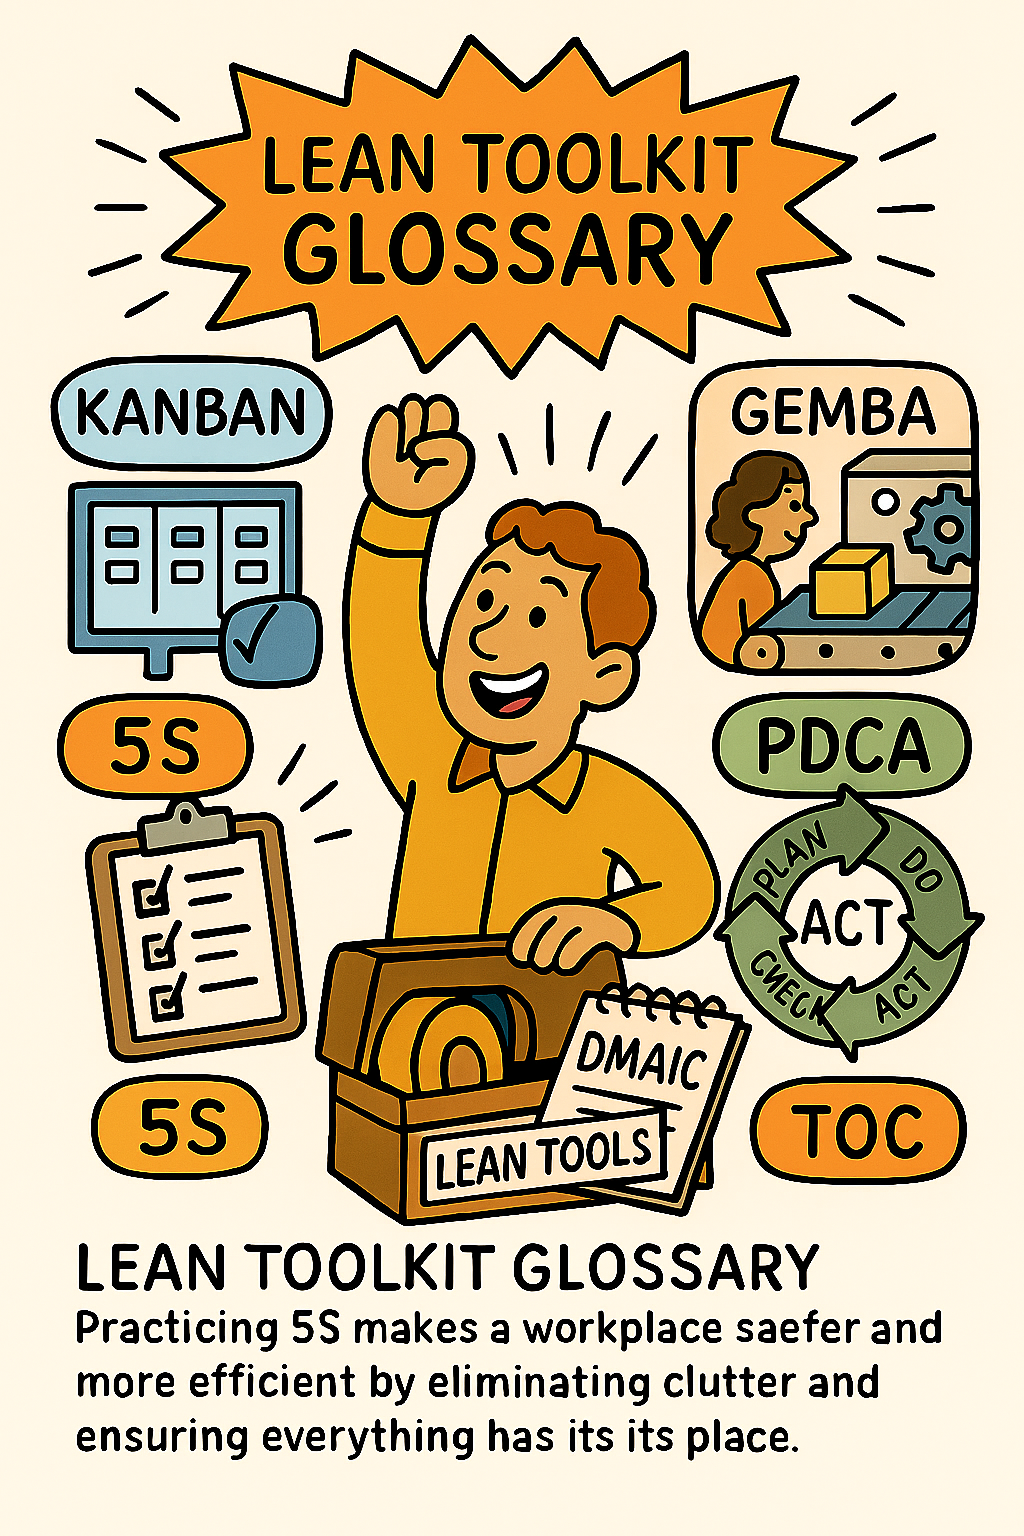
Glossary of lean tools
Fundamental Lean Tools
Strong Lean Tools
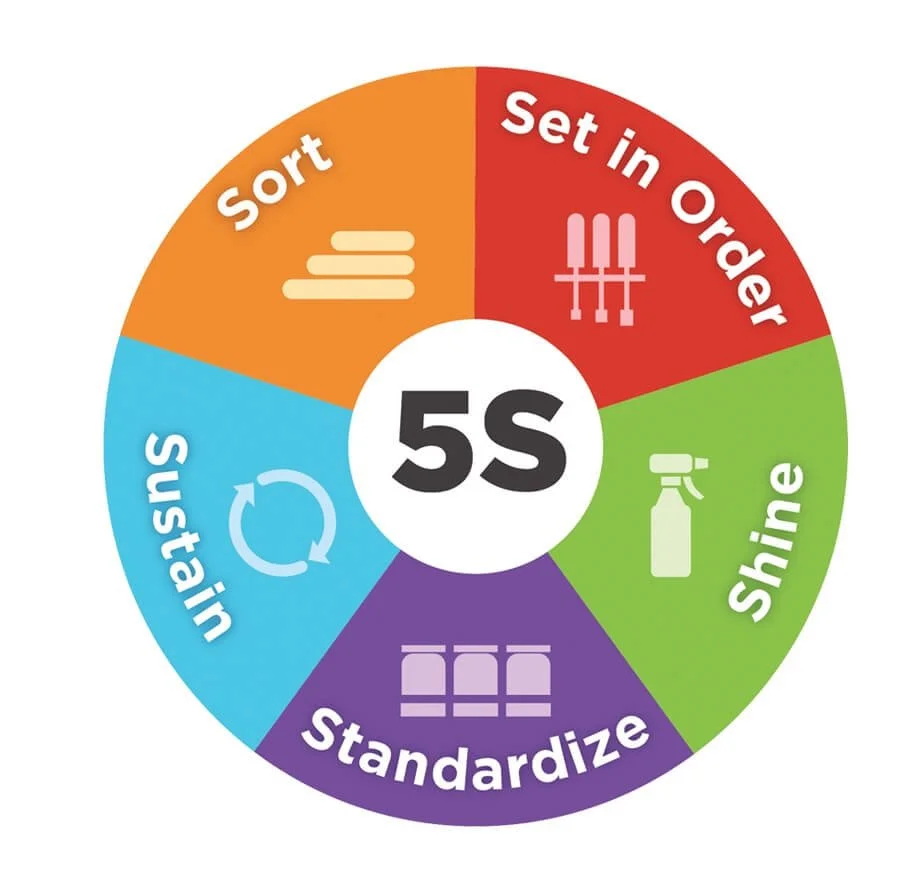
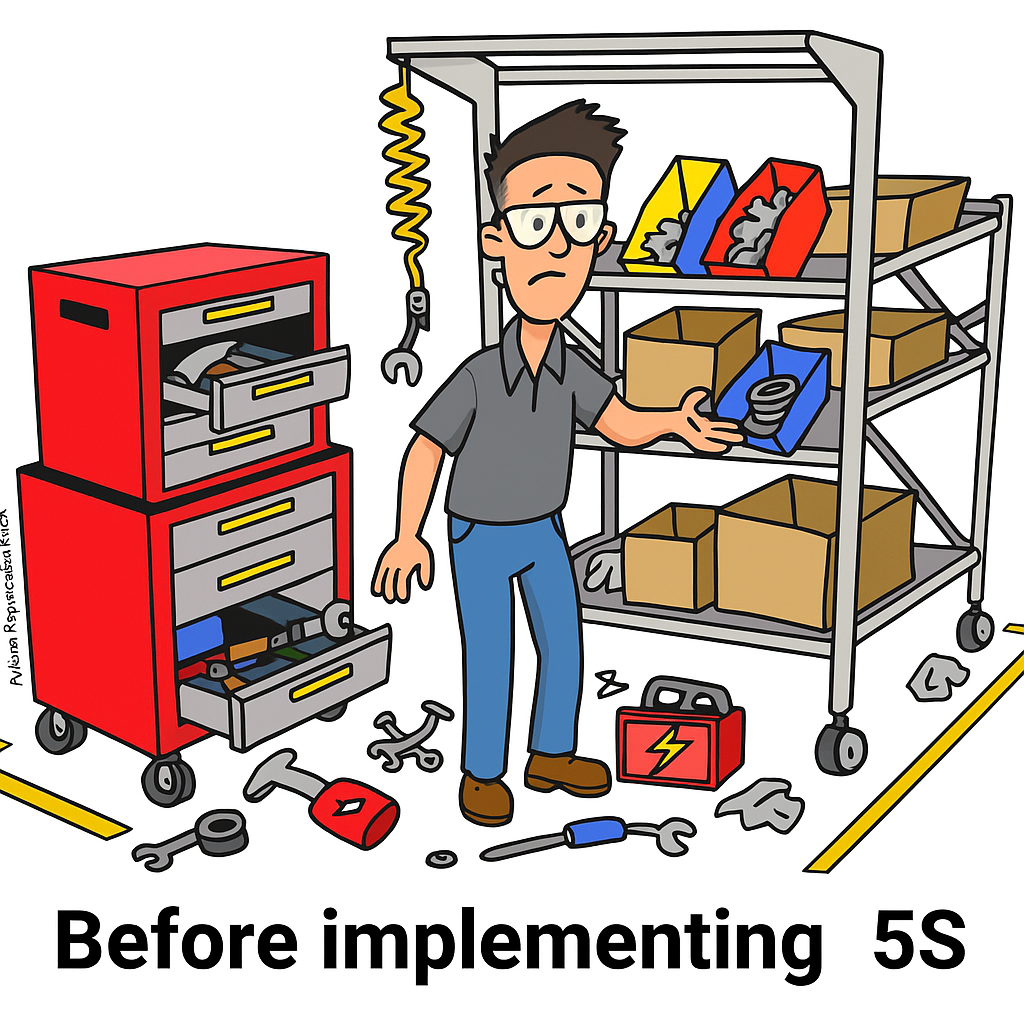
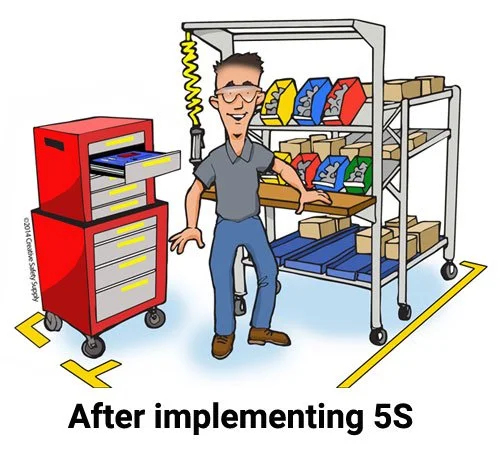
5S (Sort, Set in Order, Shine, Standardize, Sustain)
5S is a workplace organization method with five steps:
Sort means removing unnecessary items.
Set in Order means arranging needed items for easy access.
Shine involves thoroughly cleaning the work area.
Standardize establishes consistent practices for upkeep.
Sustain means keeping up the discipline.
Practicing 5S makes a workplace safer and more efficient by eliminating clutter and ensuring everything has its place. It should be used early in a Lean journey to build a foundation for other improvements, since a clean and well-organized environment helps expose problems (like leaks or defects) and reduce time wasted looking for tools.
Running this along-side a Red Tag System and Kanban Systems massively assist in organisation of your factory.
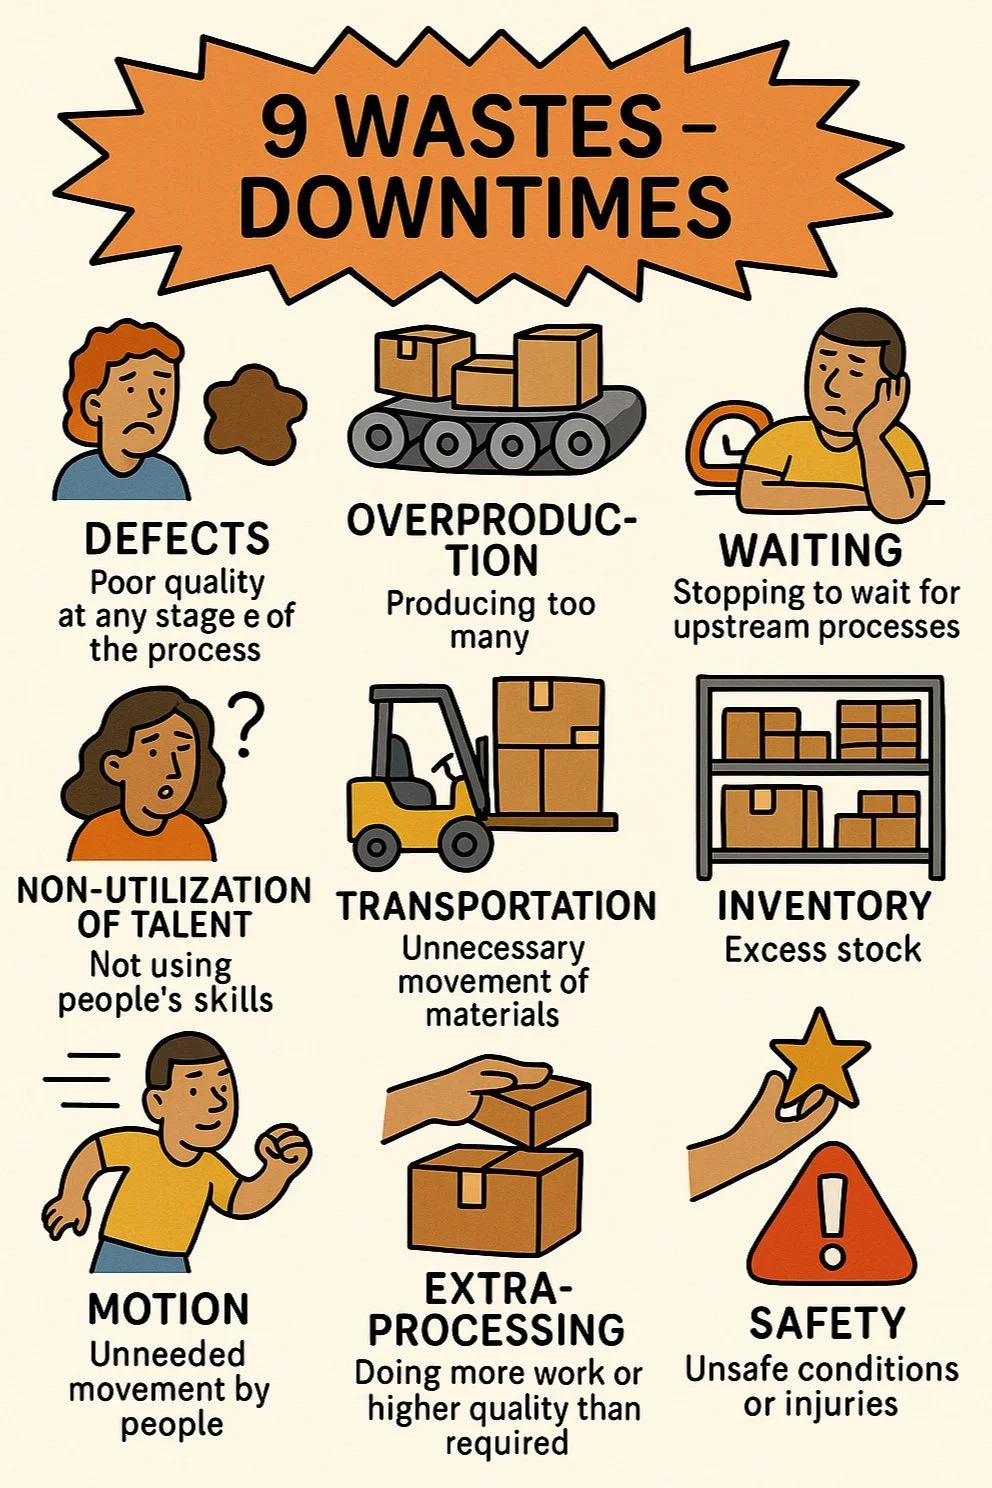
9 Wastes (DOWNTIMES)
Previously called 8 Wastes, the familiar terms for this is DOWNTIME/TIMWOODS.
However, 9 Waste is the new standard. Wastes are classified by anything that does not directly add value in the EYES OF THE CUSTOMER. Sometimes referred as only adding value when we transform raw materials into products but this is a poor definition as you can transform raw materials into products that do not end up with the customer.
9 Wastes refers to common inefficiencies in processes that Lean aims to eliminate. They are often remembered by the acronym DOWNTIMES, standing for
Defects (poor quality at any stage of the process)
Overproduction (Producing too many)
Waiting (stopping to wait for upstream processes)
Non-utilization of talent (not using people’s skills)
Transportation (unnecessary movement of materials)
Inventory (excess stock)
Motion (unneeded movement by people)
Extra-processing (doing more work or higher quality than required)
Safety (unsafe conditions or injuries)
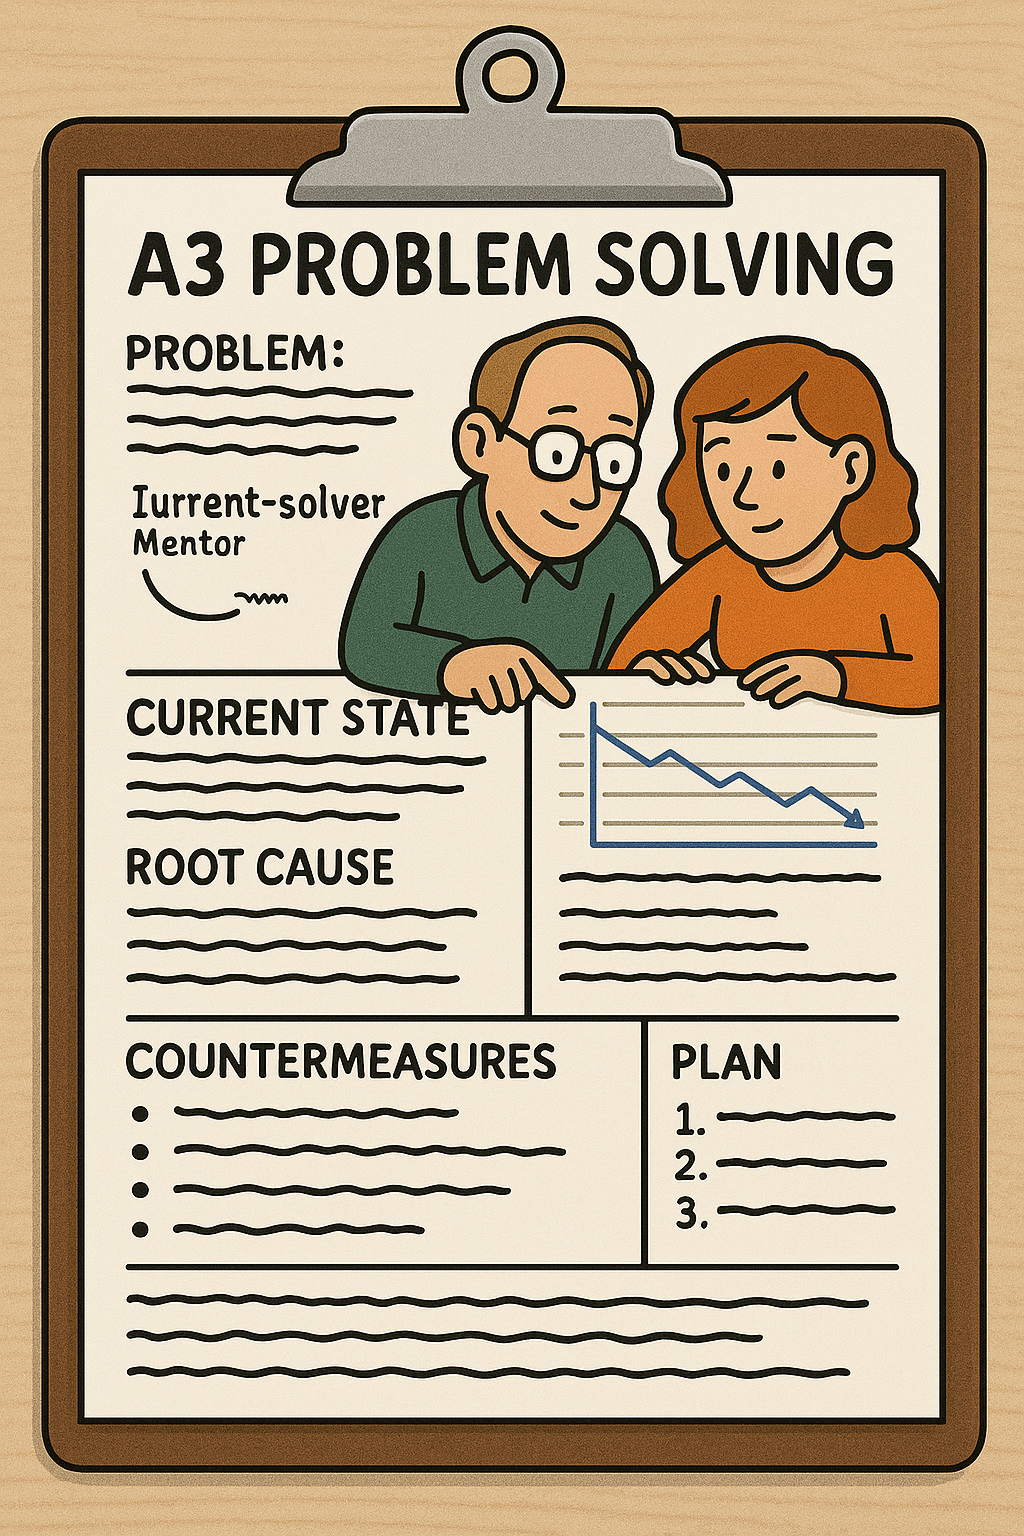
A3 Problem Solving
A3 Problem Solving is a structured approach for tackling problems by documenting the whole process on a single sheet of A3-sized paper (about 297 x 420 millimeters).
On an A3 report, the problem, root cause analysis, corrective actions, and action plan are concisely laid out, often with sketches or charts. This serves not just as a report, but as a thinking process: a dialogue tool where a mentor and a problem-solver work through the issue together, step by step.
An A3 forces clarity and focus, it should be used when addressing significant or complex problems, to ensure the team defines the current state, identifies the true root cause, proposes countermeasures, and gets agreement on an implementation plan. By using A3s, organizations develop consistent problem-solving habits and make decisions based on facts, not guesses.
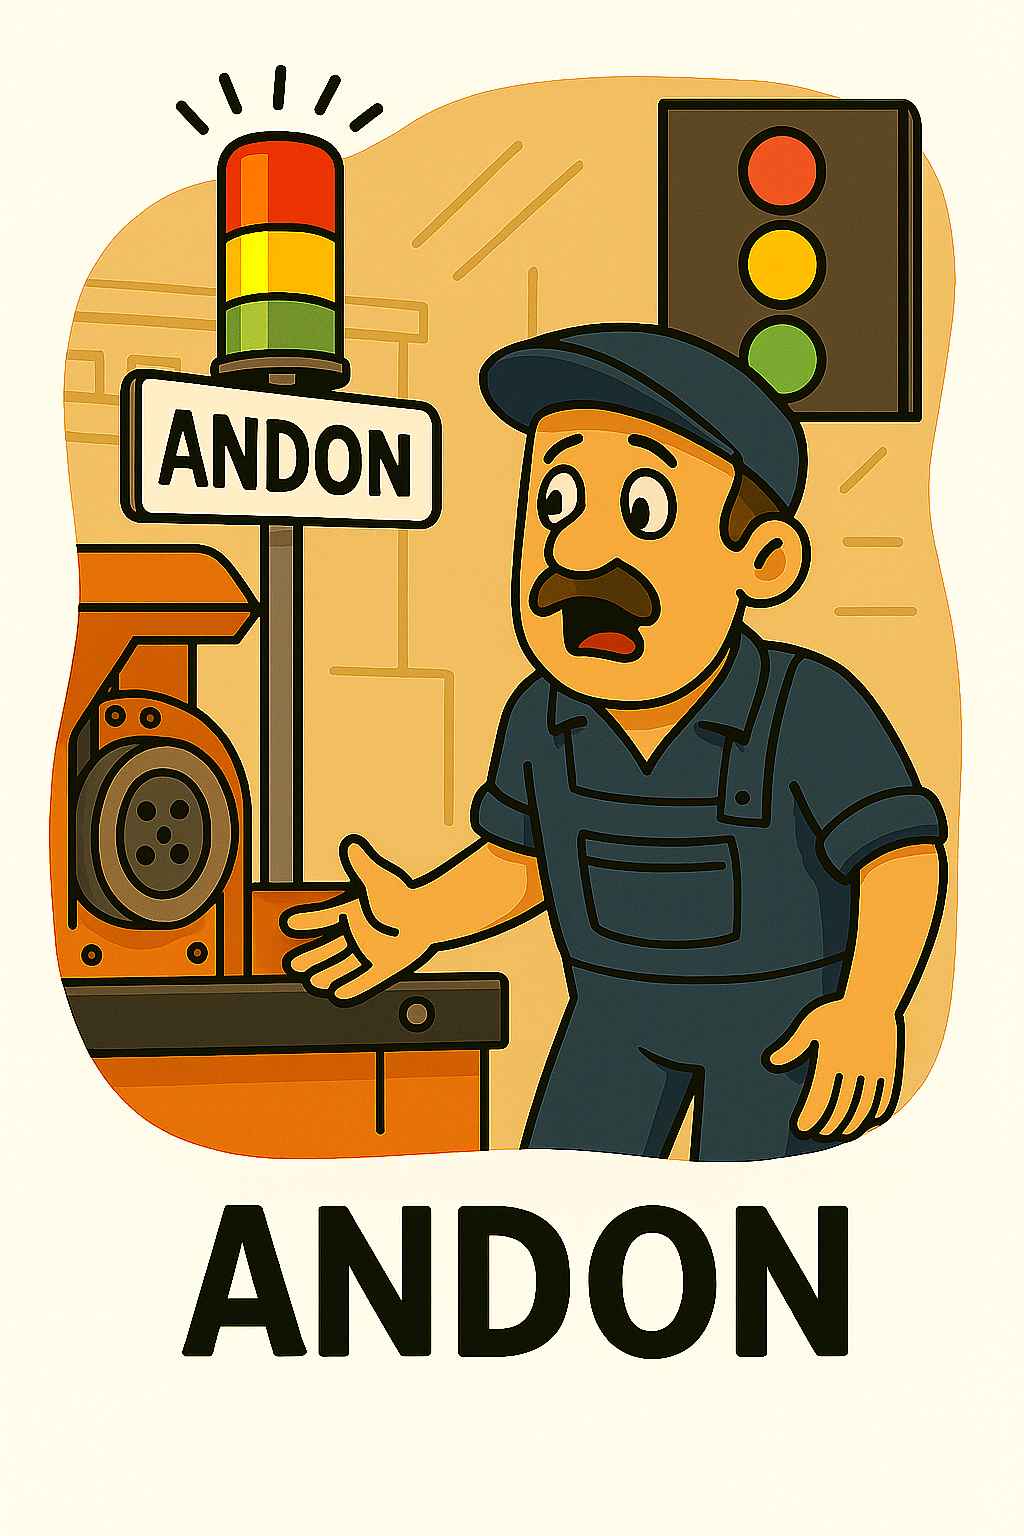
Andon (Visual Signaling System)
Andon is a visual alert system used in factories to show the status of operations and signal when help is needed. Typically it involves lights (e.g. green for normal, yellow for attention, red for problem) or electronic boards visible to everyone.
If an operator encounters a problem (like a quality issue or equipment fault), they can pull a cord or push a button to trigger the Andon. This stops the line (or flags the station) and immediately calls attention to that spot. The purpose of Andon is to get supervisors or support staff to respond right away and fix the issue so defects don’t continue.
In practice, Andon should be used to empower workers, whenever a deviation occurs, they signal it, ensuring that problems are recognized and addressed in real time, rather than hidden.
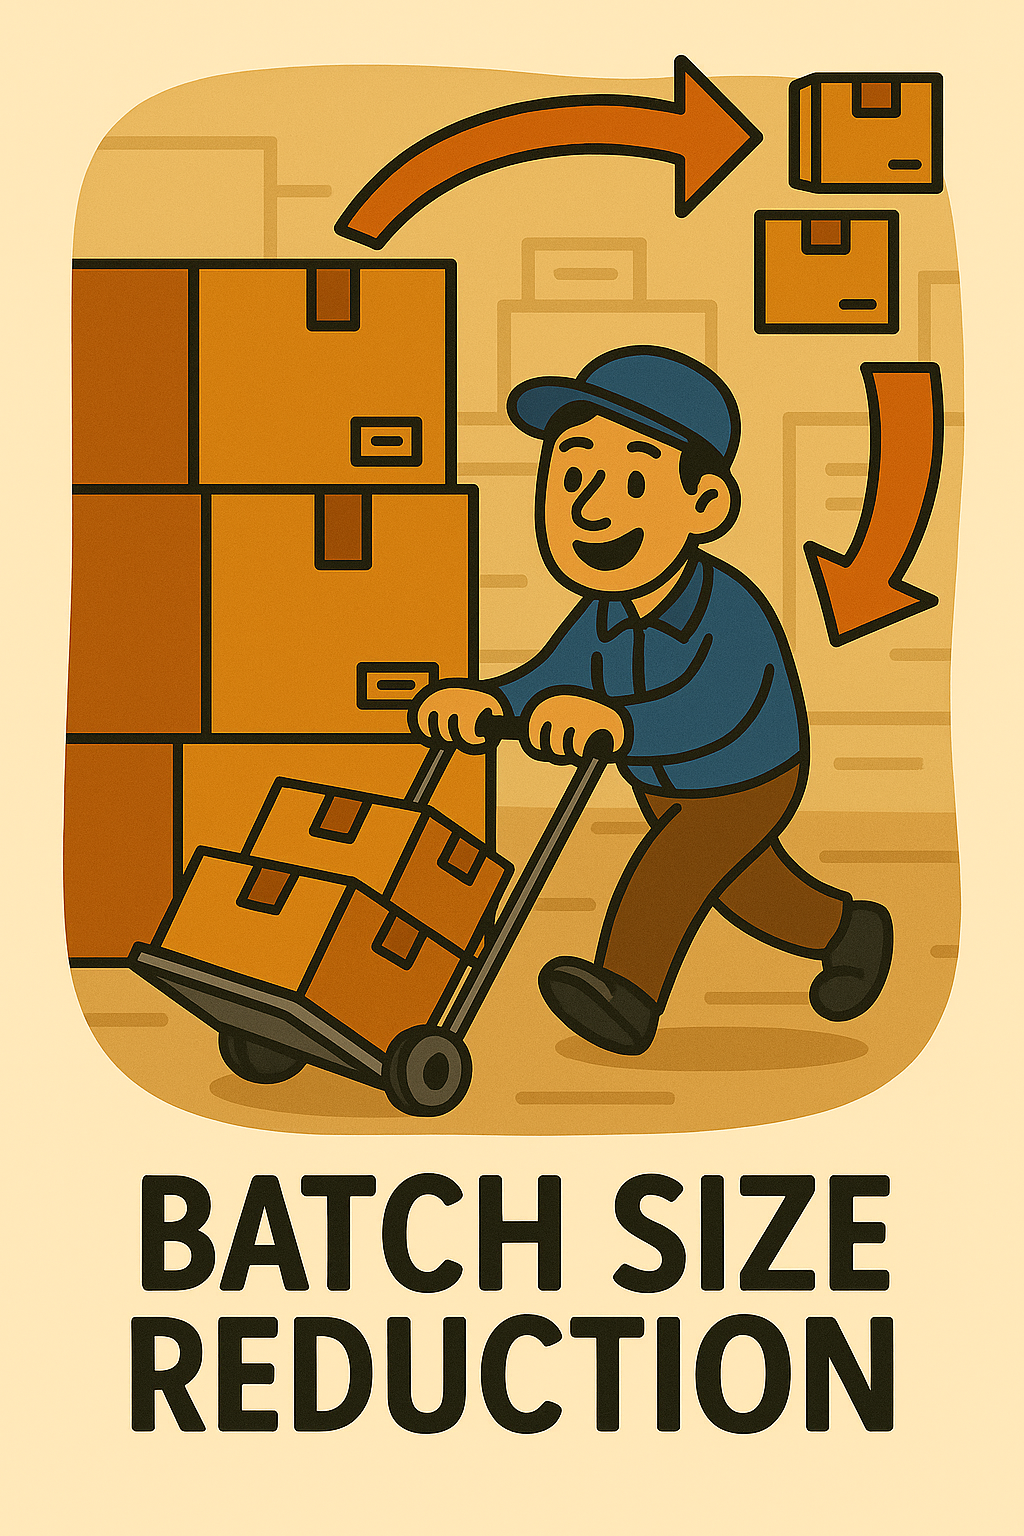
Batch-Size Reduction
Batch-Size Reduction means intentionally producing in smaller lots instead of large batches. In traditional mass production, it’s common to process big batches of a single product before switching, but Lean advocates for much smaller batches, ideally down to “single-piece flow” where possible.
By reducing batch size, you shorten the time it takes for a product to go through all steps (lead time) and cut down on piles of inventory waiting between steps. This approach is enabled by techniques like quick changeovers (so switching between products is faster) and level scheduling (mixing product types).
Use batch-size reduction when you notice work-in-progress sitting idle or customers waiting too long. Smaller batches help a process respond faster to changes in demand and reduce the waste of overproduction and storage.
The next steps from batch-size reduction is either single piece flow/continuous flow, or kanban systems and best next step being Manufacturing Resource Planning (MRPII) systems.
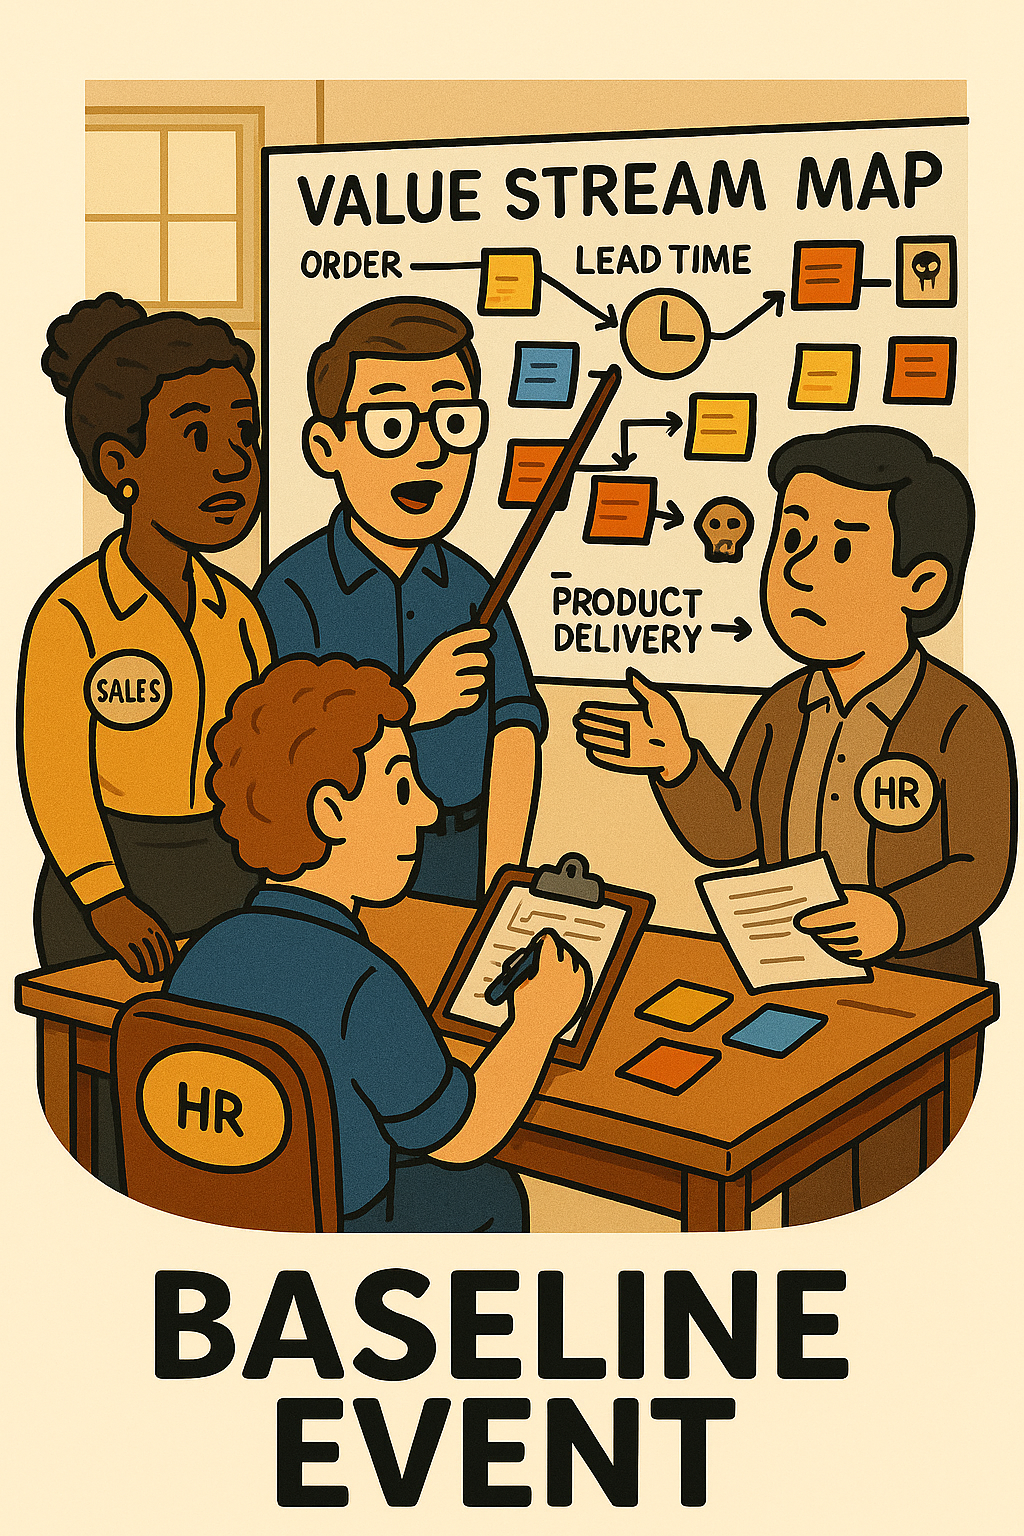
Baseline Event
A Baseline Event is a comprehensive mapping and data-collection activity that establishes the current state of a broad process, often spanning multiple departments. In a Lean context, it usually refers to a large value stream mapping workshop that looks at the entire flow from start to finish (for example, from customer order to product delivery) across the organization.
During a baseline event, participants from different functions come together to document each step, measure performance (like current lead times, error rates), and identify obvious wastes or gaps. The result is a “baseline” understanding of how things work now, which forms the basis for future improvement plans.
Baseline events should be used at the beginning of a Lean transformation or major project so the team has a clear, shared view of the starting point. By knowing the baseline, you can set targets and later compare improvements against where you began.
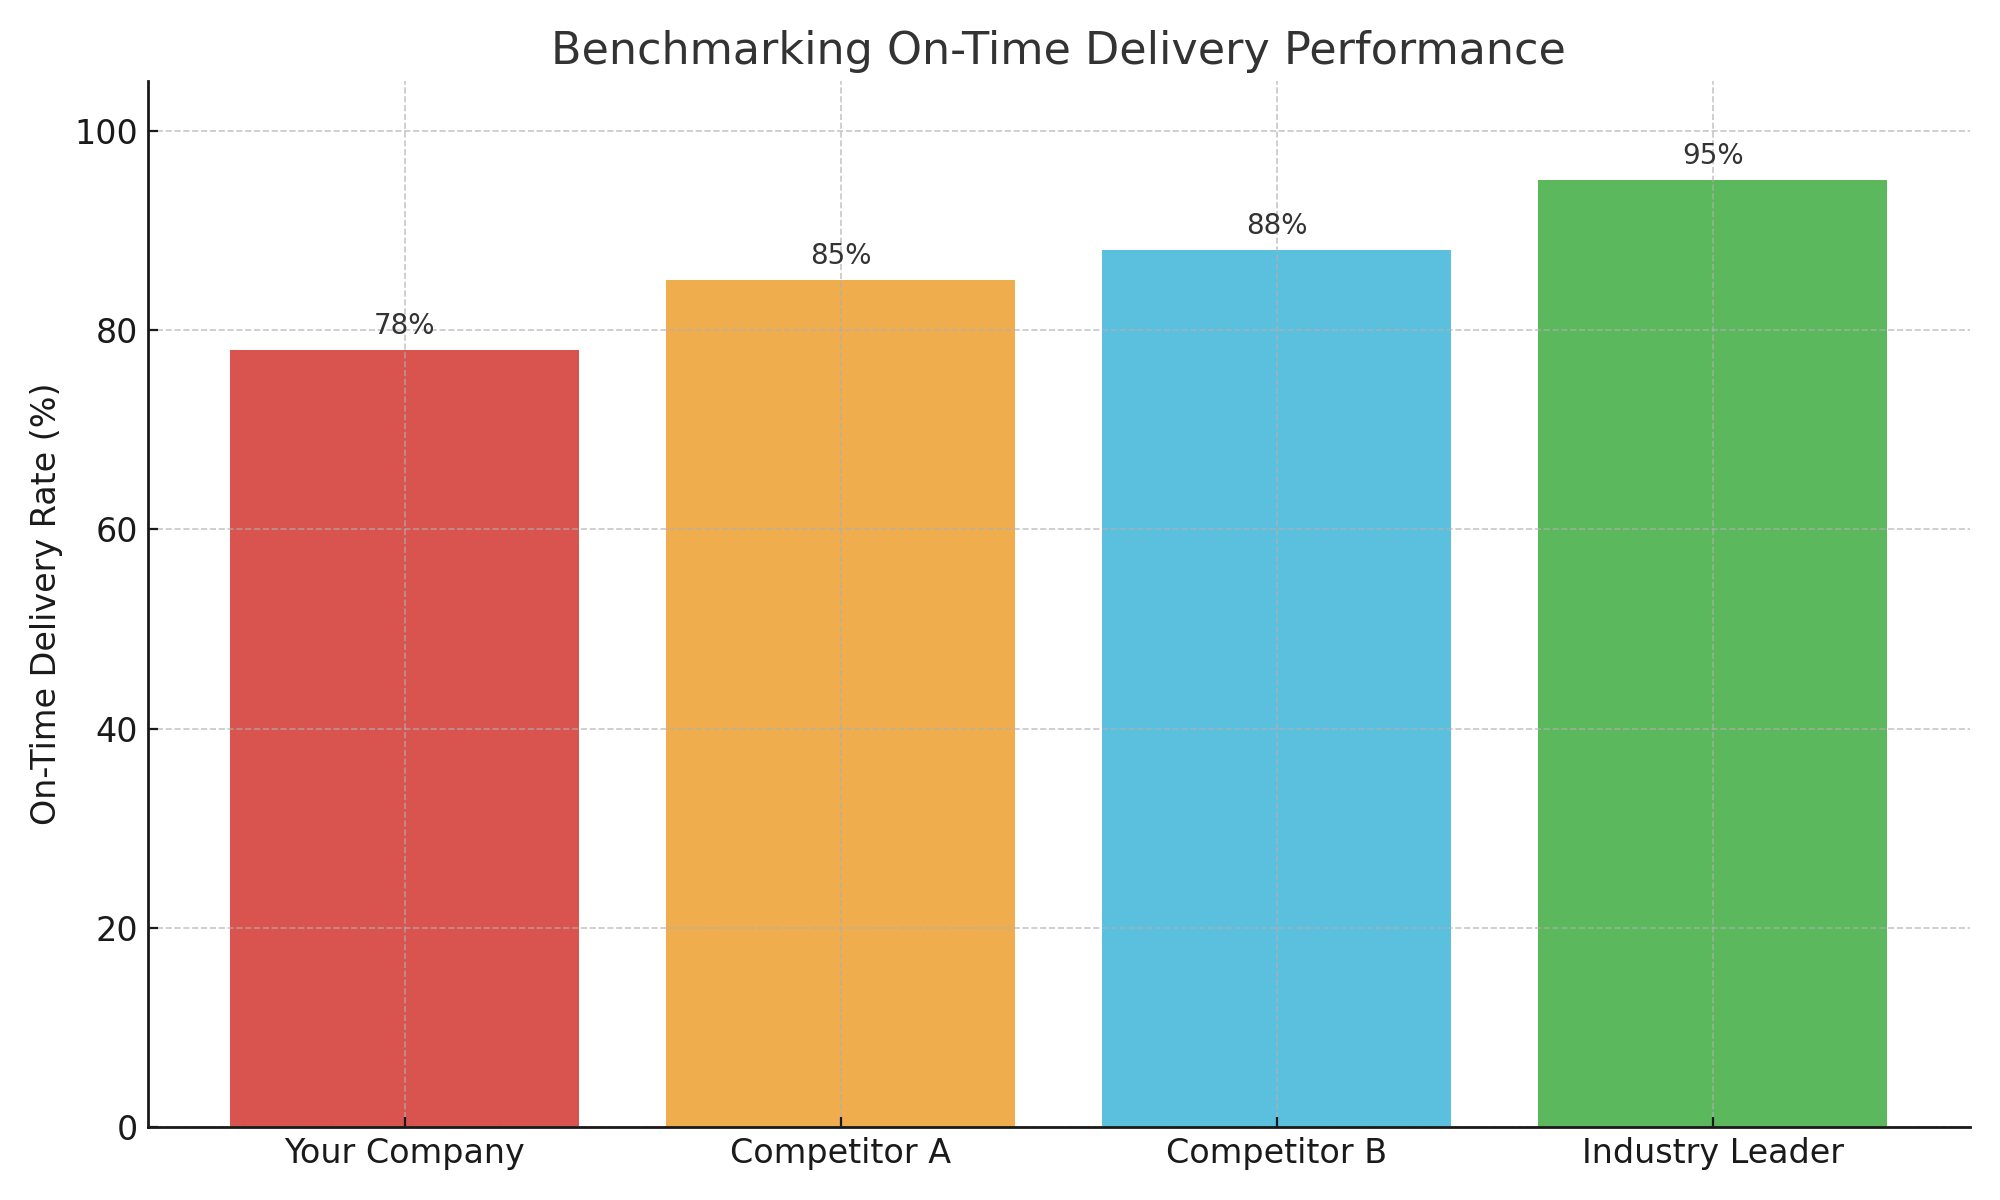
Benchmarking
Benchmarking is the practice of comparing your processes and performance metrics to those of best-in-class organizations (inside or outside your industry). The idea is to learn how others achieve excellence and identify gaps in your own operations.
In practice, benchmarking involves gathering data, for example, how fast, cost-effective, or high-quality a competitor or a recognized leader is, and then analyzing differences. It’s used to set improvement goals (“targets to beat”) and to borrow ideas for process improvements.
For instance, a manufacturer might benchmark their on-time delivery rate against an industry leader and discover areas to refine in production scheduling or supply chain management. Beginners should use benchmarking as a learning tool: it highlights what is possible and inspires changes, but it’s important to adapt others’ practices to your own context rather than copying blindly. In short, benchmarking provides an external reference point for continuous improvement efforts.
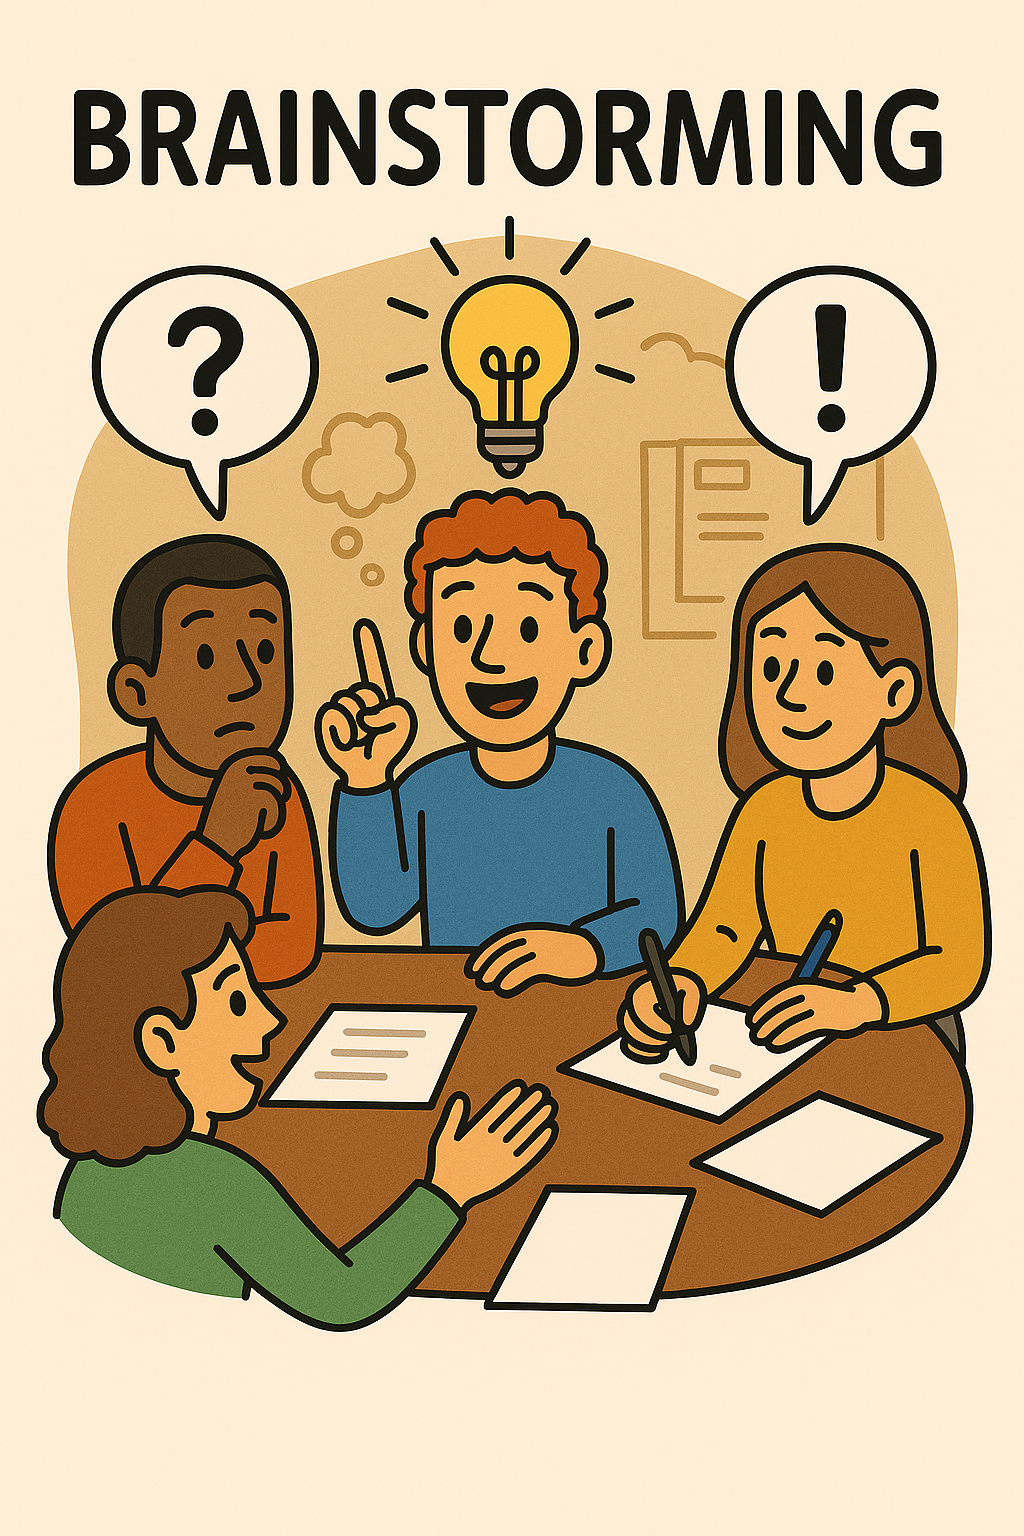
Brainstorming
Brainstorming is a team creativity technique used to generate a large number of ideas or solutions to a problem. In a typical brainstorming session, a group of people gather and are encouraged to share any idea that comes to mind, no matter how seemingly wild or small, without criticism or evaluation at first.
This free-flow of ideas helps tap into the collective knowledge and creativity of the team. Brainstorming is especially useful in Lean during problem-solving or kaizen events, for example, when identifying possible causes of a problem (everyone suggests causes) or potential solutions for an issue.
It should be used when you want to break out of conventional thinking or ensure everyone’s perspective is heard. The key rules are to go for quantity of ideas, welcome unusual ideas, and only after listing them do you review and narrow them down. By doing so, teams often discover innovative solutions or at least a few solid ideas to pursue further.
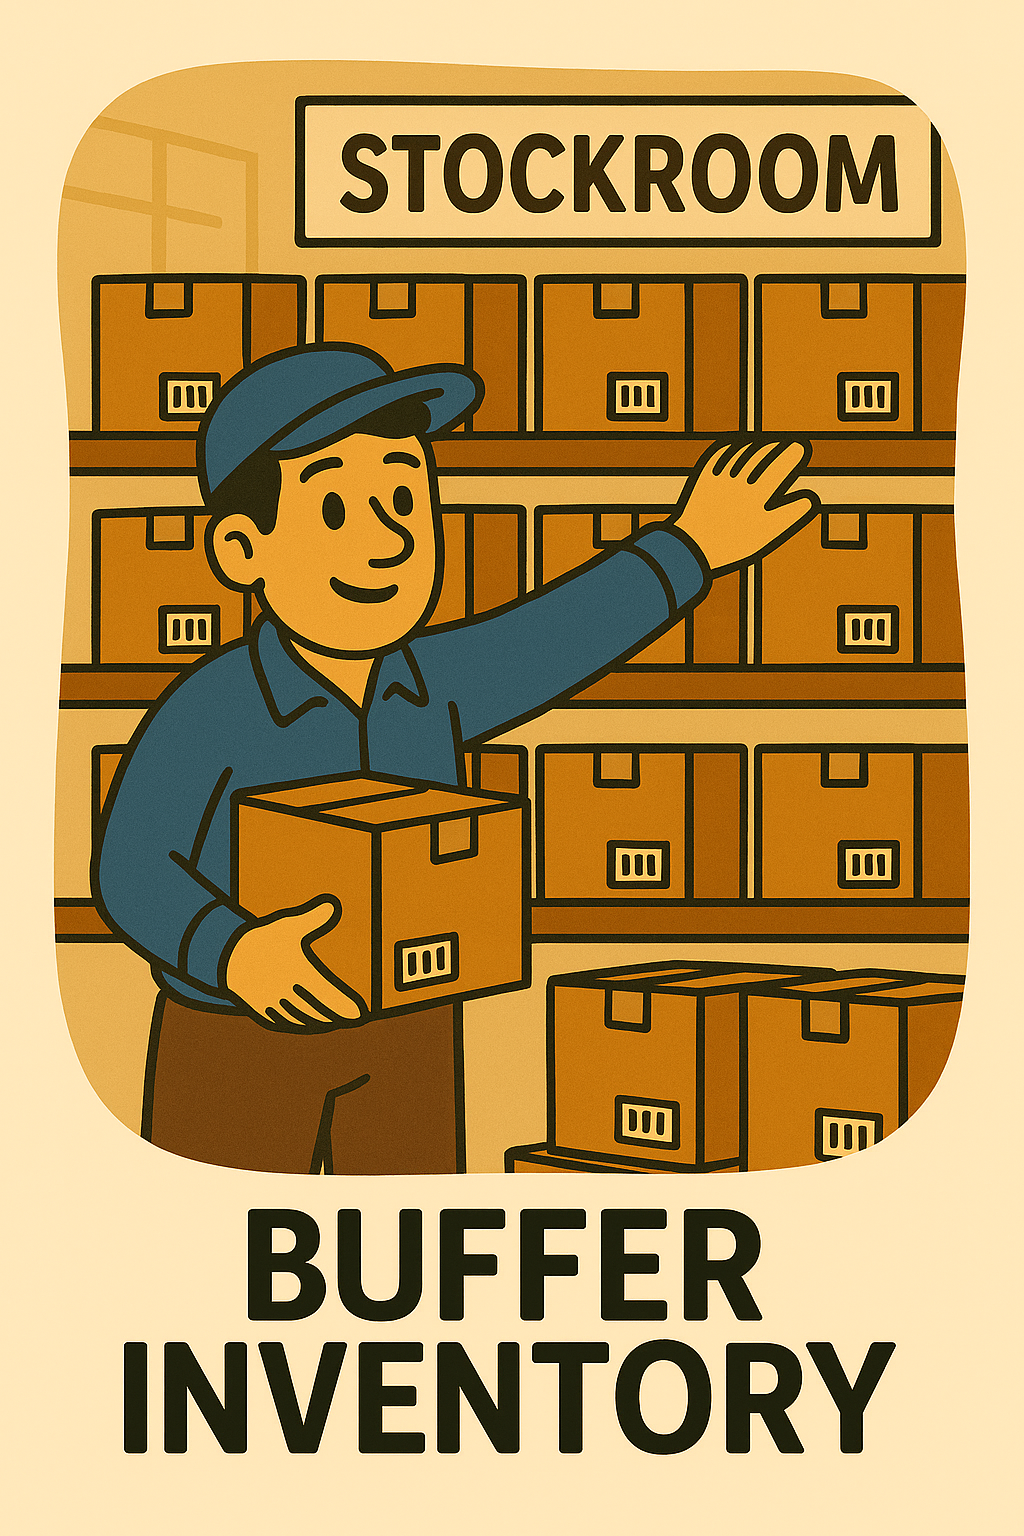
Buffer Inventory
Buffer Inventory is a small extra stock of materials or products kept on hand to absorb variations in supply or demand. In Lean thinking, inventory is generally considered wasteful, but a buffer (sometimes called a safety stock) is a deliberate cushion used to prevent process stoppages. Typically a buffer inventory should be placed before AND after key bottlenecks or fixed constraints.
For example, a work cell might keep a buffer of 10 parts between two machines so that if the upstream machine has a brief downtime, the downstream one can continue working for a while using the buffer stock.
Buffers are used when processes are not perfectly reliable or when demand is unpredictable, they provide a protection against running out of material due to sudden spikes in demand or delays in supply.
However, Lean tries to minimize buffer inventory by improving process reliability and flexibility. The goal is to rely less on buffers over time, but not to the point of causing frequent shortages. In summary, buffer inventory should be used as a temporary countermeasure to ensure flow under variability, while you work on reducing the need for it.
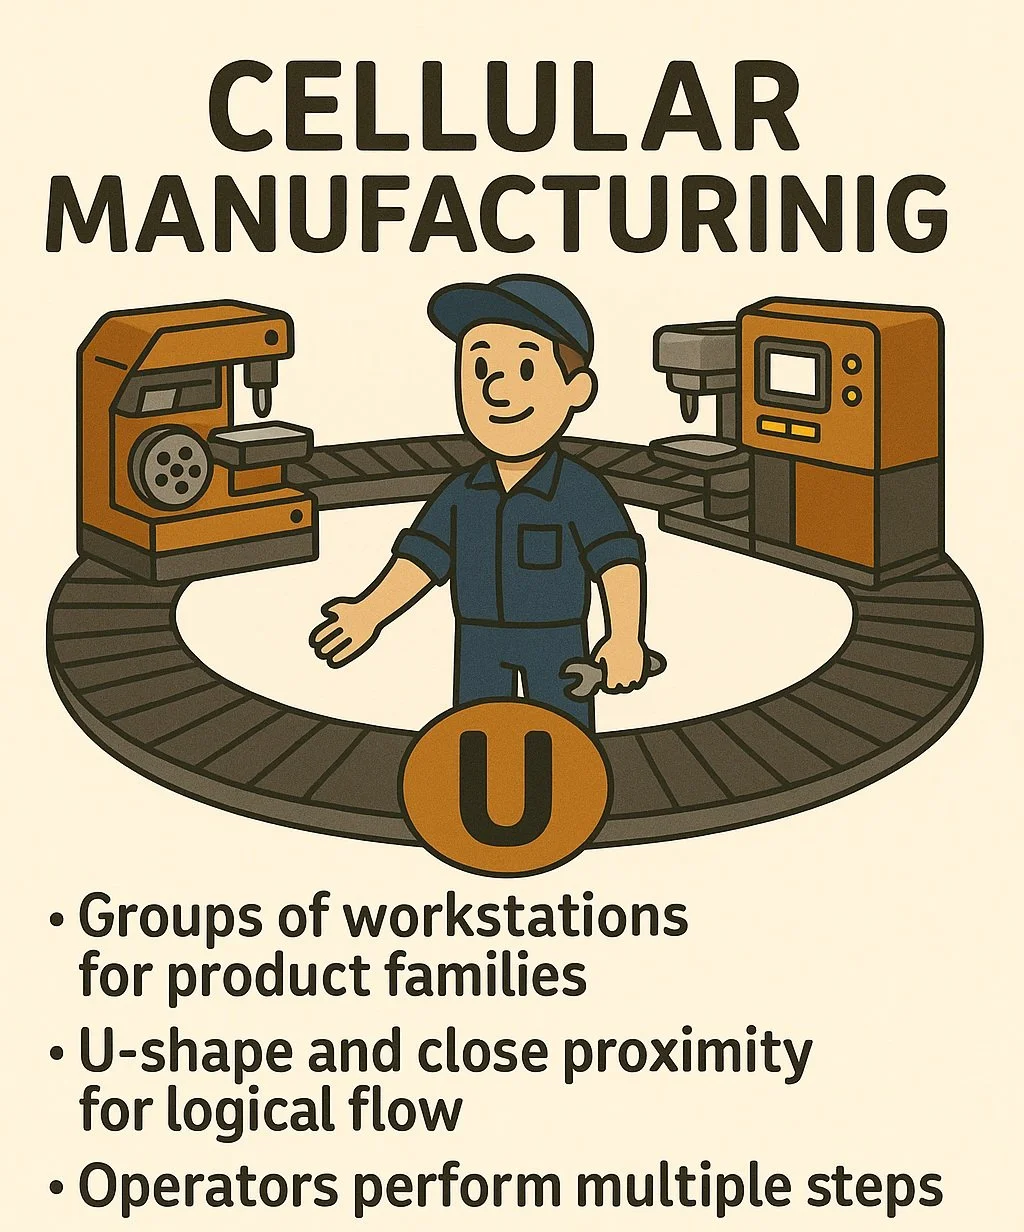
Cellular Manufacturing
Cellular Manufacturing is a method of arranging production workstations and equipment into small groups called cells, each dedicated to a sequence of steps for a family of products.
In a cell, machines or tasks are placed close together in a logical order (often in a U-shape) so that one piece flows from one step to the next with minimal transport or waiting. Operators in a cell are typically multi-skilled and can handle several process steps, which increases flexibility.
This contrasts with functional layouts (job shops) where similar machines are far apart and batches of work travel long distances. Cellular manufacturing should be used when you want to achieve continuous flow for a particular product or part type, the cell layout and dedicated team make it possible to go from start to finish in one streamlined sequence.
The benefits are reduced motion and transportation waste, shorter lead times, and often better quality (since issues are spotted quickly within the cell). Essentially, a cell is like a mini-factory focused on a defined output, making it easier to manage and improve.
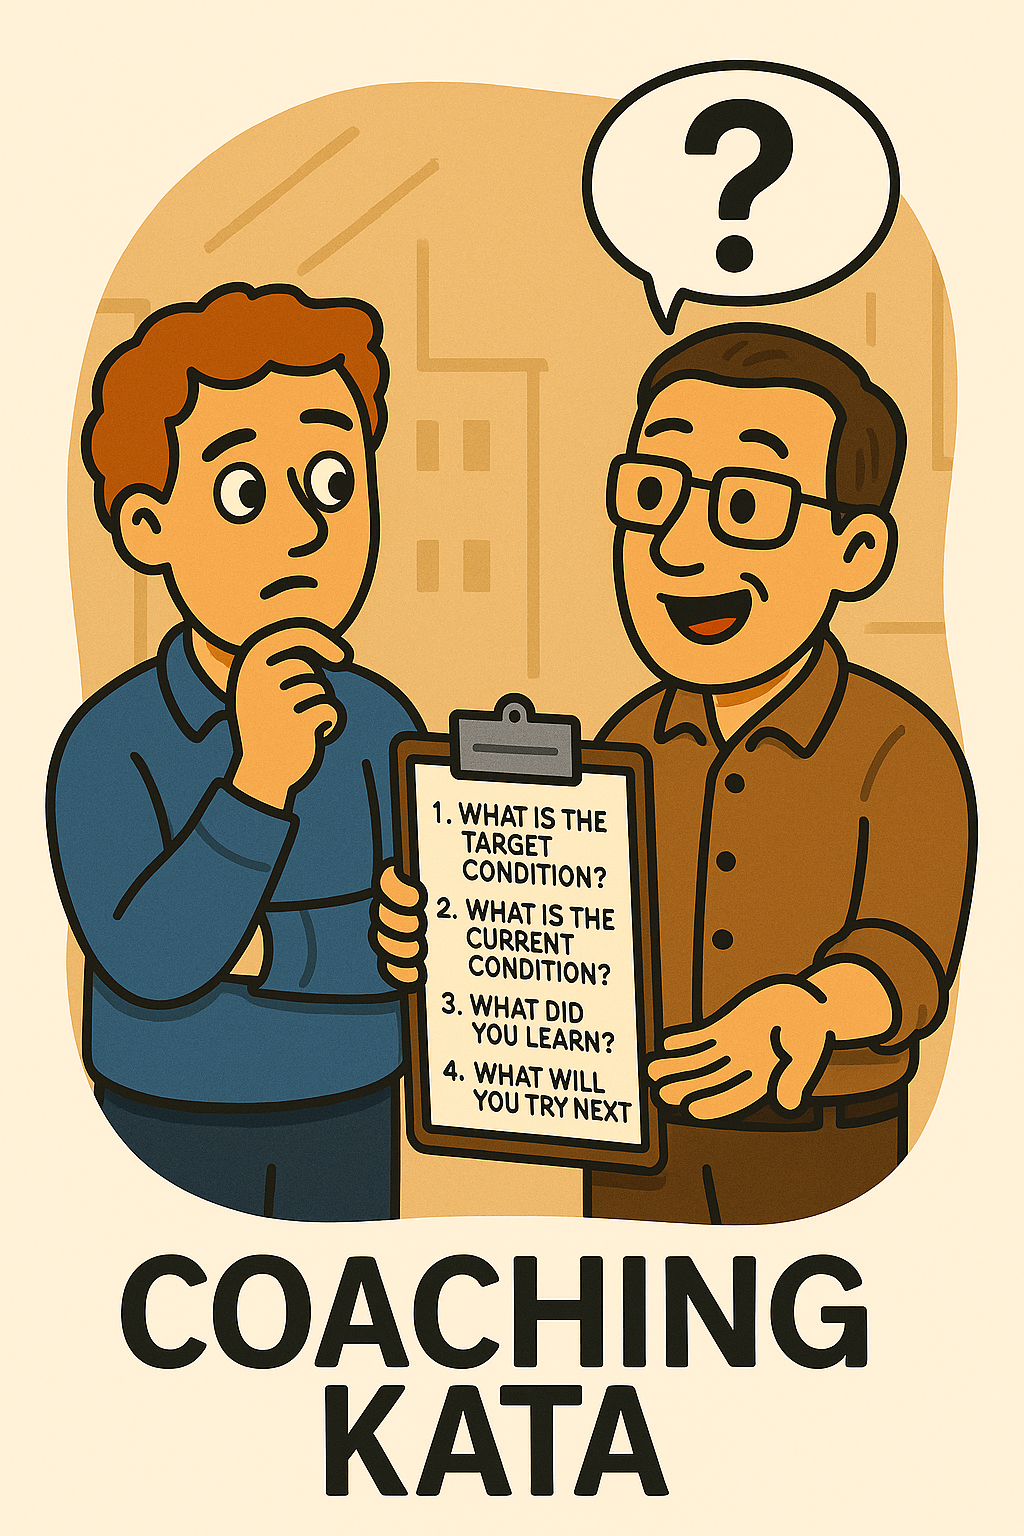
Coaching Kata
Coaching Kata is the routine that Lean leaders use to teach and reinforce continuous improvement habits (the Improvement Kata) in their teams. In Japanese, kata means a pattern or way of doing something, and the coaching kata is a pattern for how managers should guide their employees.
During coaching, a manager (or experienced coach) will regularly meet with a learner (the person working on an improvement) and follow a script of questions or steps. These questions typically include asking about the target condition, the current condition, what was learned from the last step, and what the next experiment will be.
The coach’s job is not to give solutions but to prompt the learner’s thinking and help them follow the scientific PDCA approach. Coaching kata should be used daily or frequently as part of Lean management, for example, each team lead might spend 10 minutes per day with each team member working on a problem, asking the standard questions.
Over time, this develops problem-solving skills in everyone and creates a culture where improvement is continuous and happens at all levels. In short, Coaching Kata is the discipline of coaching others in small steps so that Lean thinking becomes second nature throughout the organization.
Condition Monitoring
Condition Monitoring is a maintenance practice where you continuously observe the actual condition of equipment (via sensors or regular checks) to detect signs of potential failure. Instead of waiting for a machine to break down or just performing maintenance on a fixed schedule, condition monitoring tracks things like vibration, temperature, noise, lubrication quality, or other health indicators of the machine.
For example, if vibration levels on a motor start trending upward beyond normal, it could indicate a bearing issue developing, prompting maintenance to fix it before it fails.
This technique is often part of Total Productive Maintenance (TPM) or predictive maintenance programs, aiming to reduce unplanned downtime. The benefit is that you perform maintenance when it’s actually needed (based on evidence of wear) rather than too frequently or too late.
Beginners might use simple condition monitoring like daily operator checks (listening for odd sounds, feeling for heat) and more advanced operations might use IoT sensors for real-time monitoring. Use condition monitoring for critical equipment where failures are costly, it helps you catch problems early and transition from reactive fixes to proactive care.

Continuous Flow
Continuous Flow means moving products through the production process one unit at a time (or a very small batch at a time) with each step immediately feeding the next, without work piling up in between. In practical terms, it’s the opposite of batch-and-queue.
For example, in continuous flow a single part goes from cutting to drilling to assembly in a smooth sequence, rather than cutting 100 parts, then waiting, then drilling 100 parts, etc. The goal is to eliminate waiting, reduce inventory, and shorten the total time to make a product.
Continuous flow is achieved by arranging processes close together (often in cells or lines), balancing their cycle times, and often using small transfer batches (ideally one piece). This concept should be used whenever possible because it exposes problems (if one step stops, everything stops, so you quickly see the issue) and it is very efficient.
By having minimal buffers, continuous flow also improves quality (defects are noticed immediately) and flexibility (you can change output quickly). In summary, use continuous one-piece flow in your processes to drive out waste and accelerate throughput, it’s one of the core principles of Lean manufacturing.
However caution is advised, continuous flow is a late stage lean implementation and requires many prerequisites of lean to be working fluently such as Total Preventative Maintenance, 5S, and Kanban or MRP systems.
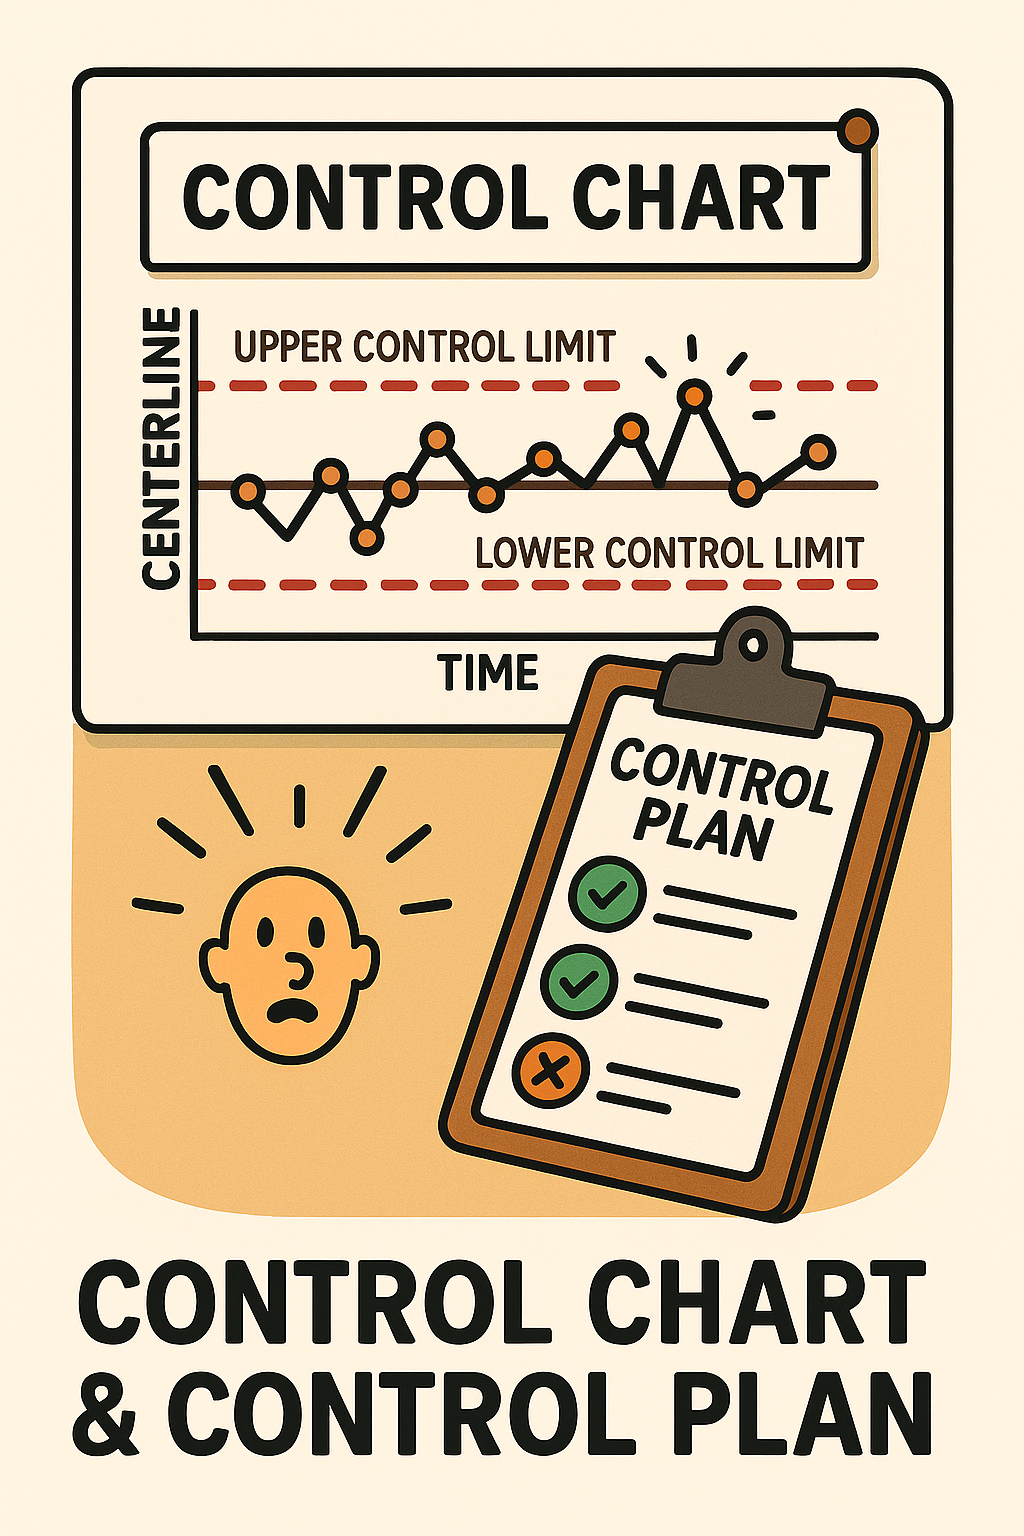
Control Charts / Control Plan
A Control Chart is a graph used in Statistical Process Control (SPC) that plots process data (like dimensions, cycle times, etc.) over time with calculated limits to determine if the process is stable. The chart has a centerline for the average and upper and lower control limits that represent the range of normal variation.
As new data points are added, you can see if they stay within the limits and display a random pattern. If points go outside the limits or show non-random patterns, that’s a signal the process might be out of control and something unusual is happening. Control charts are used to monitor ongoing processes and trigger investigation or adjustment only when needed, thus avoiding tampering when the process is fine.
A Control Plan, on the other hand, is a document that lists all the critical process steps or product characteristics, how they are controlled (e.g. measurement methods, control chart used, sampling frequency), and what to do if a problem is detected. It’s essentially a plan for sustaining the gains of an improvement by clearly specifying the monitoring and reaction strategy.
You would create a control plan after implementing improvements (say after a Six Sigma project) to ensure the process holds the new performance. Together, control charts and control plans should be used to maintain process stability and quality: the control plan outlines the overall approach, and the control charts provide real-time evidence if the process starts to go off track.
Cross-Functional Teams
A Cross-Functional Team is a group of people with different functional expertise working toward a common goal. In a Lean context, this often means that to improve a process that spans multiple departments, you bring together representatives from each of those departments into one team.
For example, launching a new product might involve a cross-functional team with members from design, engineering, manufacturing, quality, and marketing all working together. The benefit is that you get diverse perspectives and avoid sub-optimizing for one department at the expense of another.
Problems that involve handoffs or misunderstandings between functions (like between sales and production, or between procurement and inventory management) can be solved much more effectively when all parties collaborate.
Cross-functional teams should be used when processes or projects naturally cut across the organizational silos, such as value stream mapping exercises, Kaizen events, or continuous improvement projects, so that all stakeholders have input and buy-in.
By working in cross-functional teams, organizations break down silos, improve communication, and ensure that solutions consider the whole system, not just one piece.
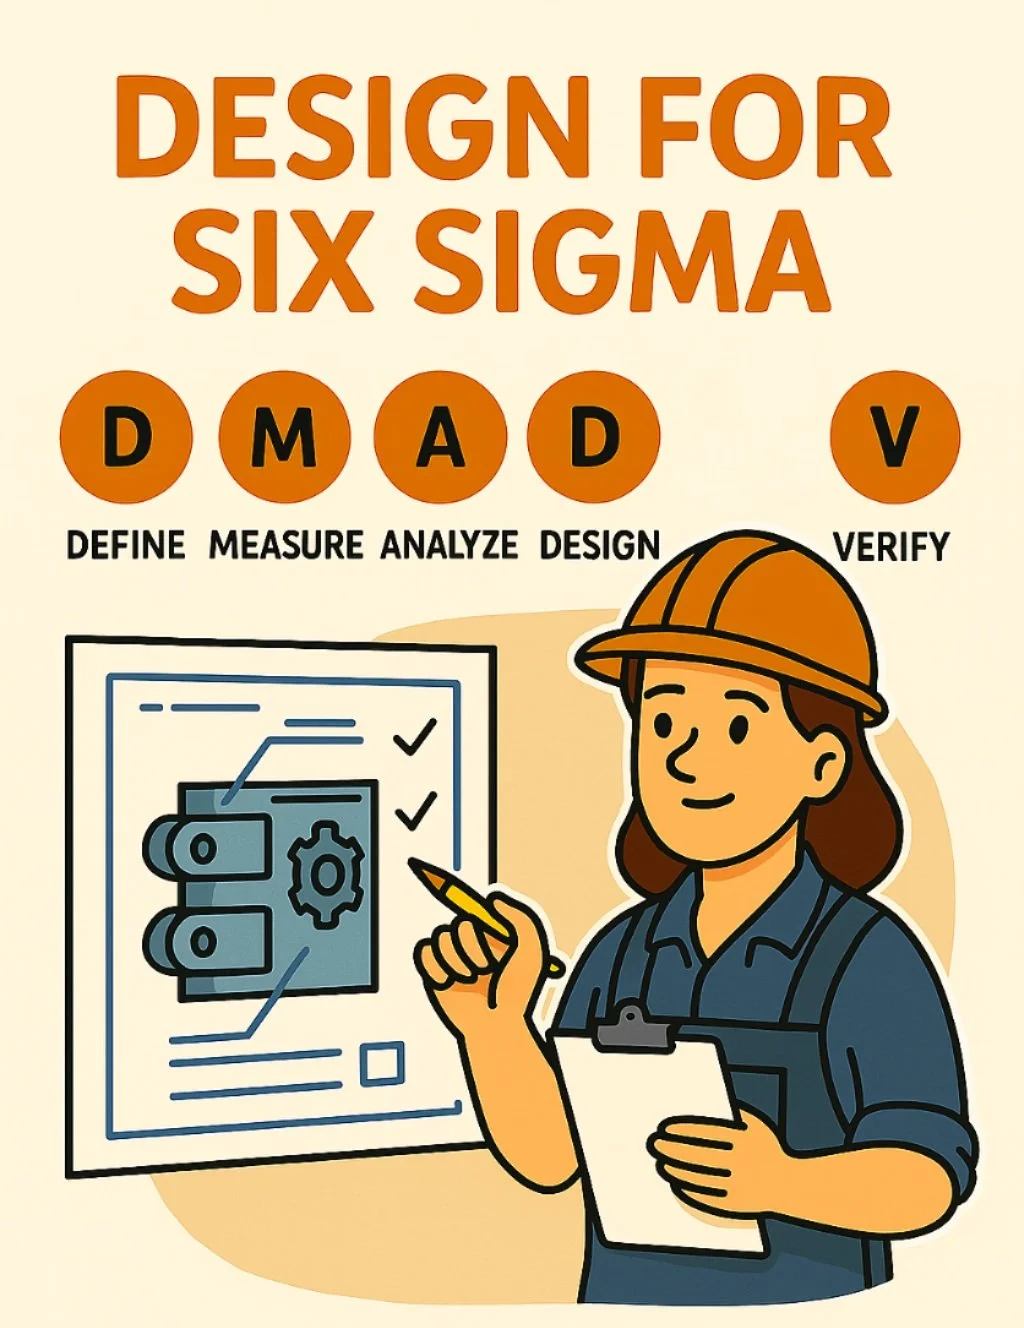
Design for Six Sigma (DFSS)
Design for Six Sigma (DFSS) is a methodology for designing products or processes from the ground up so that they meet customer needs and achieve Six Sigma quality levels (very few defects). Whereas traditional Six Sigma’s DMAIC process is used to improve existing processes, DFSS is used for new developments or major redesigns.
It typically follows its own roadmap, often referred to as DMADV: Define, Measure, Analyze, Design, Verify. In these steps, a team:
Defines customer requirements and project goals;
Measures what’s needed and benchmarks;
Analyzes options and trade-offs;
Designs the product/process using predictive tools and simulations;
Verifies that the design performs as intended.
The DFSS approach should be used when simply improving an existing process might not achieve the needed performance, or when launching a new product where you want to “build in” quality and efficiency from the start.
DFSS employs many tools (like Quality Function Deployment, FMEA, robust design, etc.) to ensure the design is robust and capable. The result is that when the new process or product goes live, it already operates with minimal defects and waste, reducing the need for fixes later.
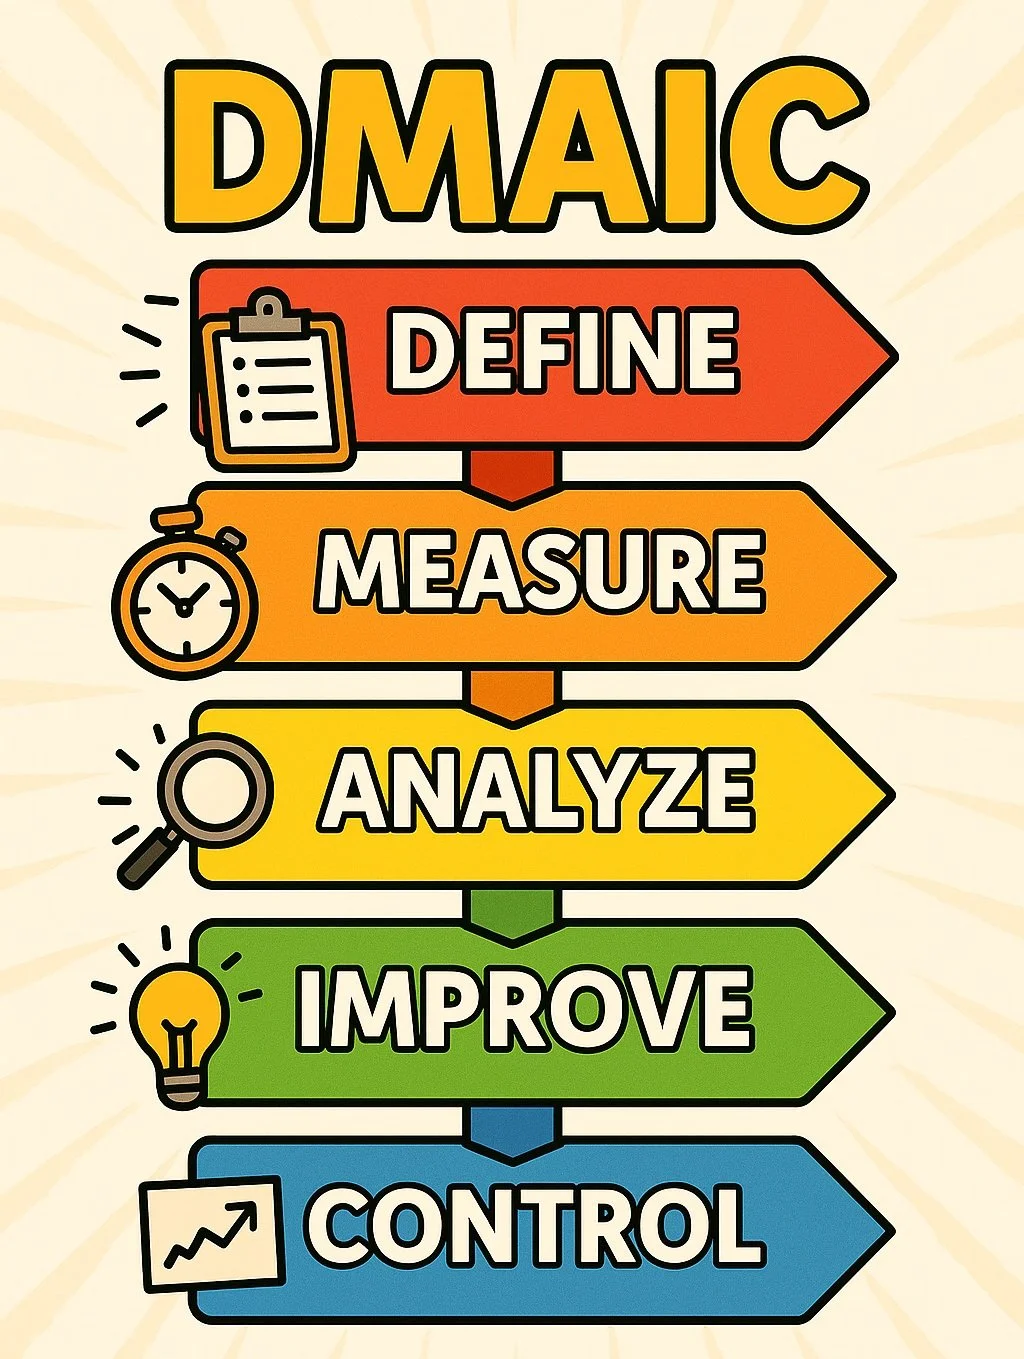
DMAIC (Define Measure Analyze Improve Control)
DMAIC is similar to PDCA as it defines the problems in quantitative measures rather than qualitative measures. It should be used when statistical data is readily available or is critical to the customers. EG. Food industries that must sell above the advertised weight.
DMAIC is a five-phase structured problem-solving cycle used in Six Sigma and Lean Six Sigma projects. The phases are:
Define - identify the problem or improvement opportunity, set the goal, and understand customer requirements;
Measure - collect data to establish current performance and quantify the problem;
Analyze - dig into the data to find root causes or key factors affecting the outcome;
Improve - generate and implement solutions to address root causes; and
Control - put measures in place to sustain the gains, such as process controls or standard work.
Each phase has specific outputs and tools; for example, in Define you might create a project charter and SIPOC diagram, in Measure you calculate baseline metrics, in Analyze you might do Pareto analysis or hypothesis tests to pinpoint causes, etc. DMAIC should be used for complex or chronic problems where the solution is not obvious and a data-driven approach is needed.
It’s the backbone of Six Sigma improvement efforts, ensuring that teams follow a systematic path from problem definition to verified solution. By the end of Control, you have not only fixed the issue but also documented the new process and set up monitoring (like control charts or checklists) to make sure the problem doesn’t recur.
In summary, DMAIC is a roadmap that helps teams reduce variation and waste by attacking issues in a methodical way.
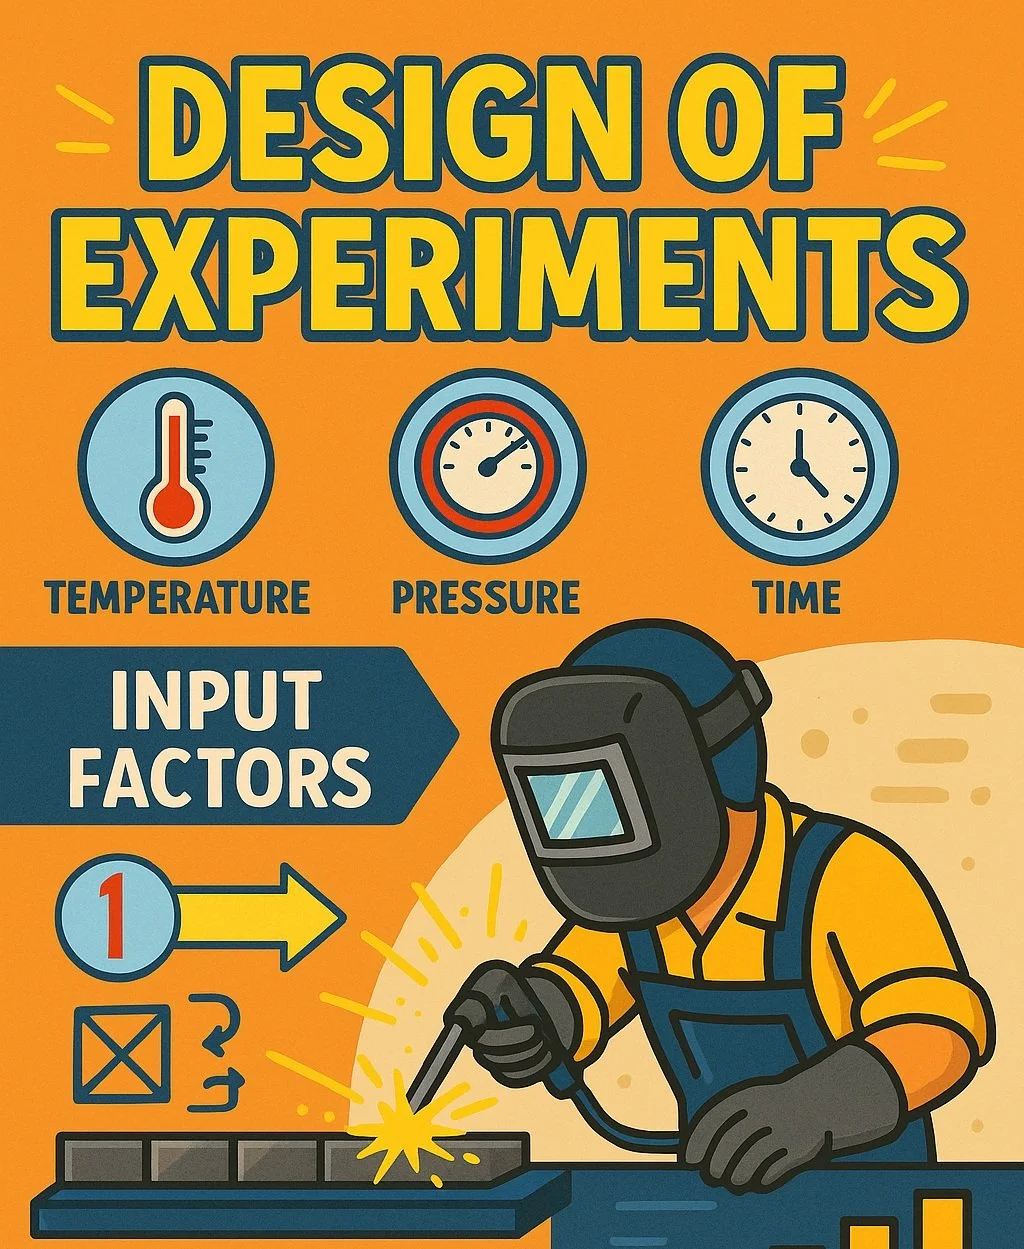
Design of Experiments (DOE)
Design of Experiments (DOE) is a structured method for conducting tests on a process in order to understand the relationship between different input factors and the output results.
Instead of changing one factor at a time (which can be inefficient and fail to show interactions), DOE involves changing multiple factors in a planned pattern so that you can separate out the effects of each one and any combination effects.
For example, imagine you have a welding process where temperature, pressure, and time could all affect strength. A DOE approach would systematically vary these parameters (e.g. low/high settings in a matrix of trials) and then use statistical analysis to determine which factors significantly influence weld strength and what the optimal levels might be.
DOE is particularly useful when you need to optimize a process or product design, it finds the “sweet spot” without having to test every possible combination blindly. It should be used in the Analyze or Improve phase of projects (especially in Six Sigma or engineering) when you suspect several variables contribute to an issue or when designing a new process to be robust.
By using DOE, teams can achieve breakthroughs in performance by scientifically pinpointing what really matters and tuning the process accordingly, all with a minimal number of experiments.
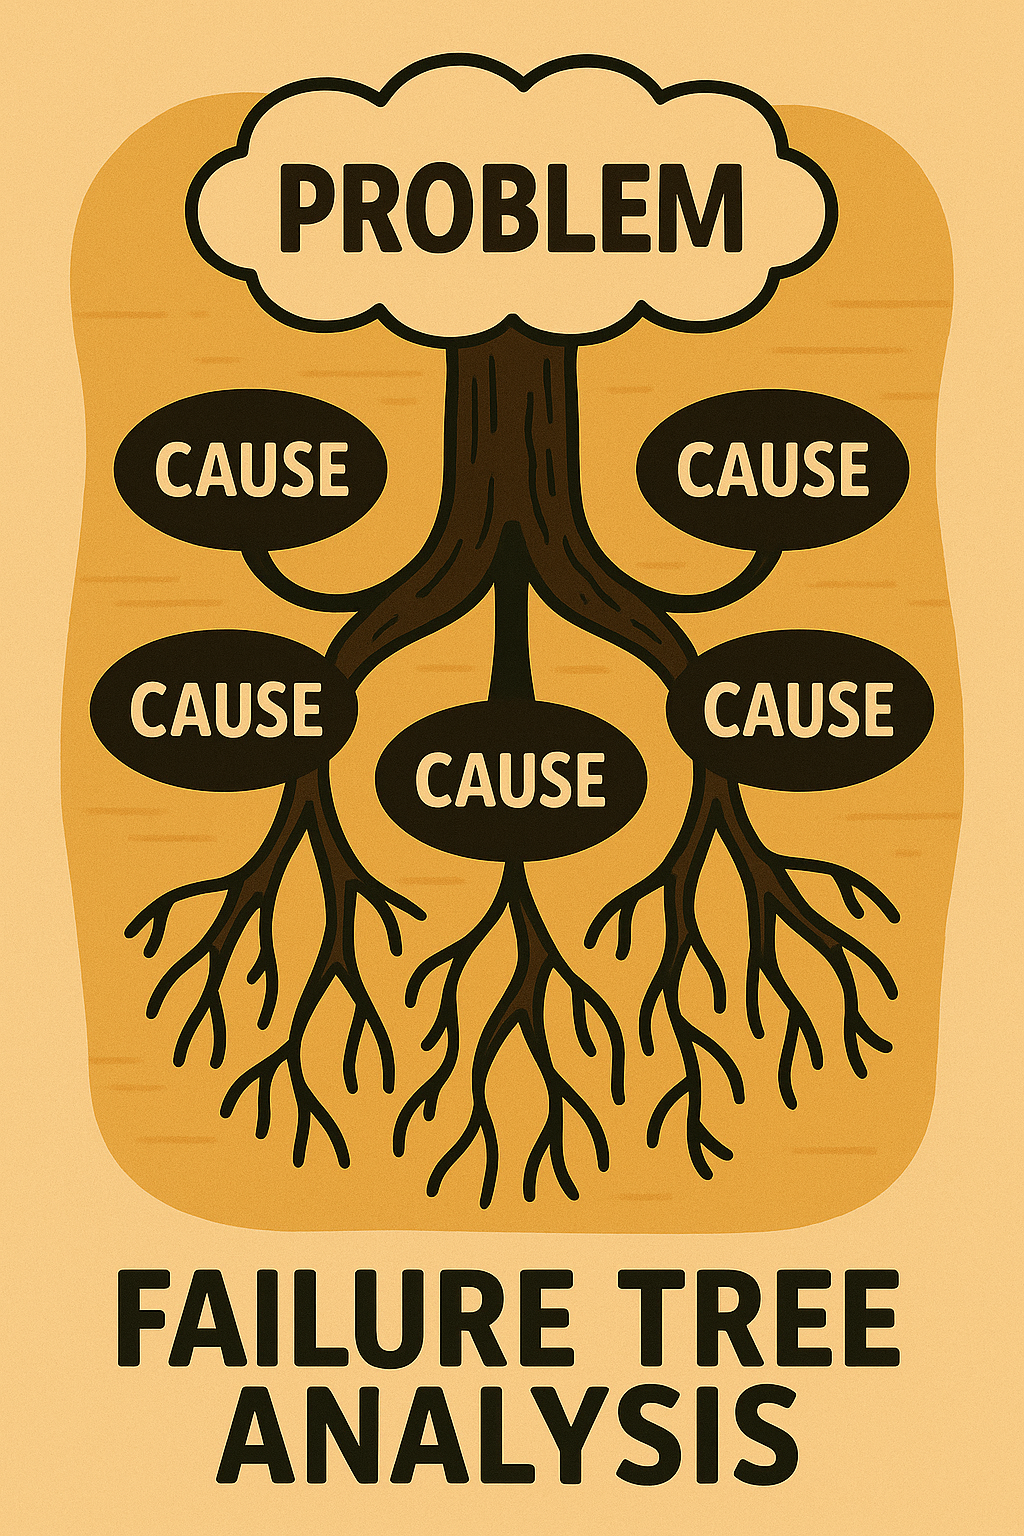
Failure Tree Analysis (FTA)
Failure Tree Analysis (FTA), often called Fault Tree Analysis, is a systematic technique for analyzing the causes of a potential system failure by mapping them out in a tree-like diagram. You start with an undesirable top event (like “machine will not start” or a safety incident) and then identify all the possible immediate causes for that event.
Each of those causes is then broken down further into its causes, using logical gates (AND/OR relationships) to show how combinations of lower-level failures could lead to higher-level failures. The result is a diagram that looks like a tree (or an upside-down tree) of failure causes branching out.
FTA is used in reliability and safety engineering to proactively find weaknesses in a design or process. By examining the fault tree, you can identify which basic events (like component failures or human errors) are most critical to address because they appear in many paths to failure or have a high probability.
You should use Failure Tree Analysis when dealing with complex systems where an issue could result from many interrelated factors, for example, analyzing what could cause an airplane engine to fail or a chemical plant emergency. By understanding these cause-and-effect relationships, you can implement targeted preventive measures and increase the overall reliability of the system.
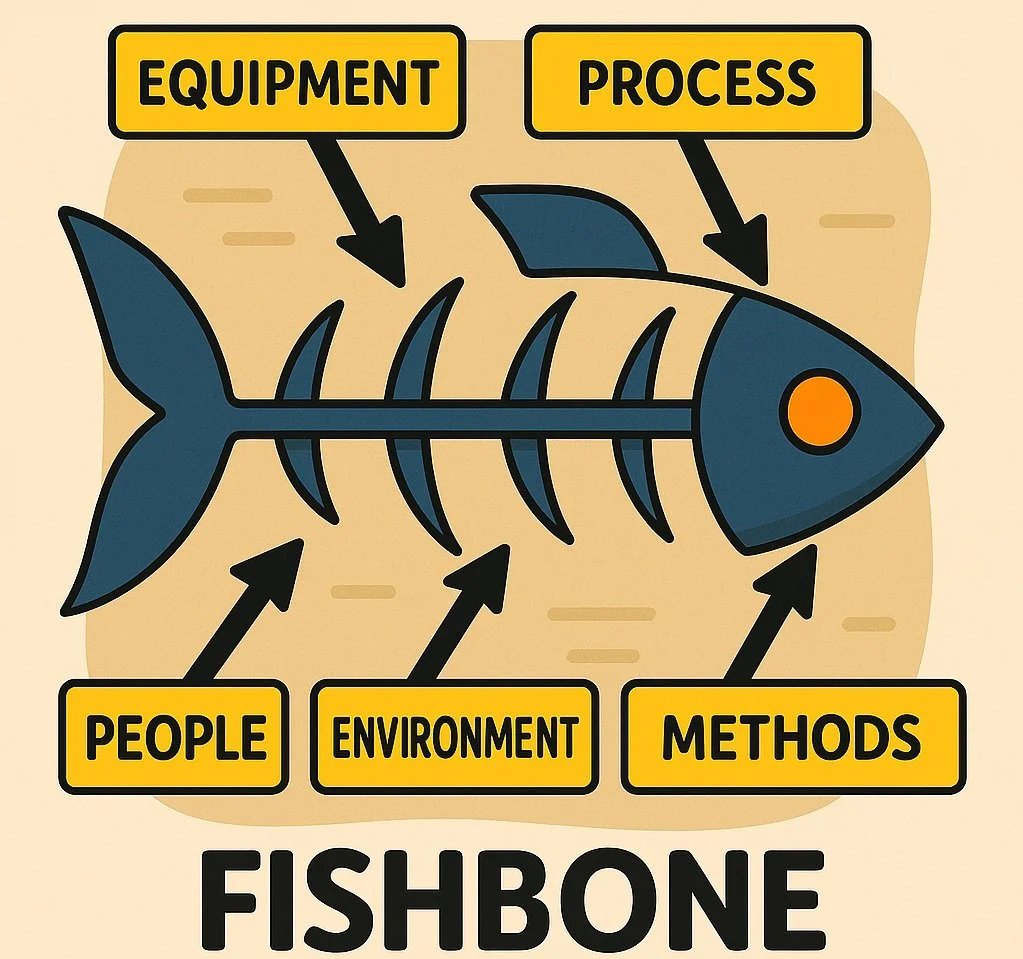
Fishbone Diagram (Cause-and-Effect Diagram)
A Fishbone Diagram, also known as an Ishikawa diagram or cause-and-effect diagram, is a visual tool for systematically listing all the possible causes of a problem and sorting them into categories. It gets its name because the diagram looks like a fish skeleton: the problem statement is the “head” of the fish, and the main categories of causes (like Methods, Machines, Materials, Manpower, Measurement, Environment, sometimes called the 6Ms) are the “bones” branching off from the spine.
Under each category, you brainstorm specific causes and draw them as smaller bones. This layout helps teams in a brainstorming session cover different angles and not just focus on one type of cause.
You should use a Fishbone Diagram when you want to perform root cause analysis on an issue, for instance, why defects are occurring in a product, why a delivery was late, or why an office process has errors. It’s especially helpful early in problem-solving to capture hypotheses about causes in an organized way.
Once the fishbone is filled out with potential causes, the team can then investigate or collect data to pinpoint which of those are the real root causes. In sum, the Fishbone Diagram is a simple but effective way to break down a problem and encourage broad thinking about its sources.
Floor Layout Optimisation
Floor Layout Optimization is the practice of arranging the physical workspace (machines, workstations, storage, aisles, etc.) in the most efficient configuration to support flow and minimize waste.
In Lean, the way equipment is laid out on the factory or shop floor has a huge impact on productivity, a poor layout can cause excessive walking, transporting materials long distances, difficulty in supervision, and safety hazards.
Optimizing the floor layout often involves moving machines into cells or lines (for continuous flow), placing sequential processes near each other, and ensuring that materials and people have clear, short paths. Techniques like Systematic Layout Planning (SLP) or using spaghetti diagrams (tracing current movement paths) help identify better arrangements.
You should consider floor layout optimization when you see that employees are spending a lot of time traveling back and forth, when there are congestion points, or when introducing a new product line. Even in an office, layout matters (e.g. placing teams that work closely in proximity).
The goal is to create a visual, logical flow: inputs come in one end and outputs leave from the other with minimal backtracking. After an optimized layout, you typically see reduced motion and transport waste, faster process times, and sometimes freed-up space that was previously taken up by unnecessary travel or inventory.
It’s a fundamental part of making a Lean process, make the physical environment support the ideal process flow rather than forcing the process to work around a bad layout.
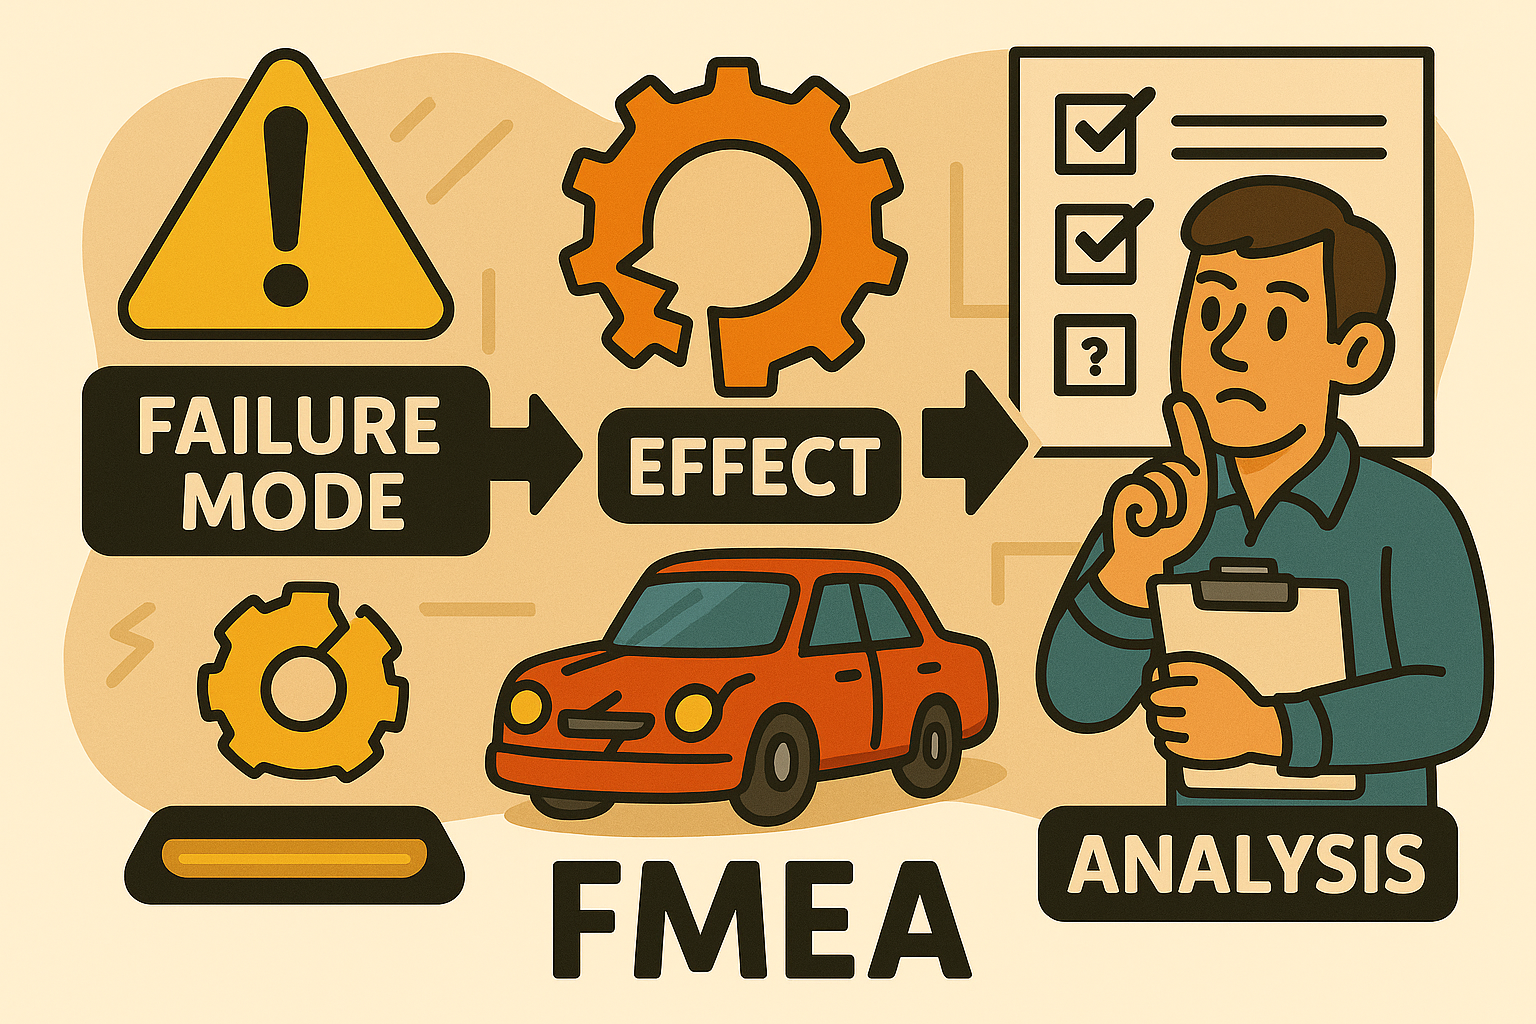
FMEA (Failure Modes & Effects Analysis)
FMEA (Failure Modes and Effects Analysis) is a proactive tool for identifying and preventing problems before they occur in a product or process. In an FMEA, a cross-functional team lists out potential failure modes (the ways in which something could go wrong or not function as intended), then for each failure mode, they brainstorm effects (what would happen if that failure occurs) and causes (why it might happen).
They then usually rate each failure mode on:
Severity - how bad the effect is;
Occurrence - how likely the cause is and;
Detection - how likely it would be caught before it reaches the customer.
These ratings are combined into a risk priority number (RPN) to prioritize which issues need action. The team then recommends actions to reduce the risk, like design changes or new controls, for the highest-priority failure modes.
FMEA is often used during product development or early in a process improvement to anticipate problems. For example, an automotive design team would do an FMEA on a braking system to think of all possible failure modes (leak, wear, etc.) and ensure controls are in place. Beginners should use FMEA when launching something new or when a process has known issues but unclear causes, it provides a structured way to think of “what could go wrong.”
By doing FMEA, you essentially create a to-do list of improvements or safeguards to implement, thereby reducing the chance of failures in real operation.

Gemba Walk - Go Look See
A Gemba Walk is a Lean practice where managers and leaders regularly go to the actual place where work is done (gemba means “the real place” in Japanese) to observe the process and engage with employees. The idea is similar to “management by walking around,” but with a structured purpose: to grasp the current situation firsthand, ask questions, and show support.
During a Gemba walk, the leader might watch a production line in operation, ask operators about any hurdles they face, check housekeeping and safety conditions, or see how a service process flows in an office. The key is to go with an open mind to learn, not to micromanage or find fault.
Gemba walks should be used frequently (daily or weekly) because they keep management informed of reality versus assumptions. By seeing problems on the floor, leaders can help remove obstacles and also coach employees in problem-solving. It also signals to workers that management cares about what’s happening on the ground.
For beginners, a Gemba walk is a great way to start a Lean initiative: just go out to where value is created and observe, you will almost always notice improvement opportunities you wouldn’t have seen from behind a desk.
Taiichi Ohno of Toyota famously drew a circle on the floor and made supervisors stand in it to watch, because direct observation is invaluable. In summary, “Go to Gemba” whenever you need to understand a process deeply or when performance isn’t meeting expectations; the answers often become clear when you see with your own eyes.
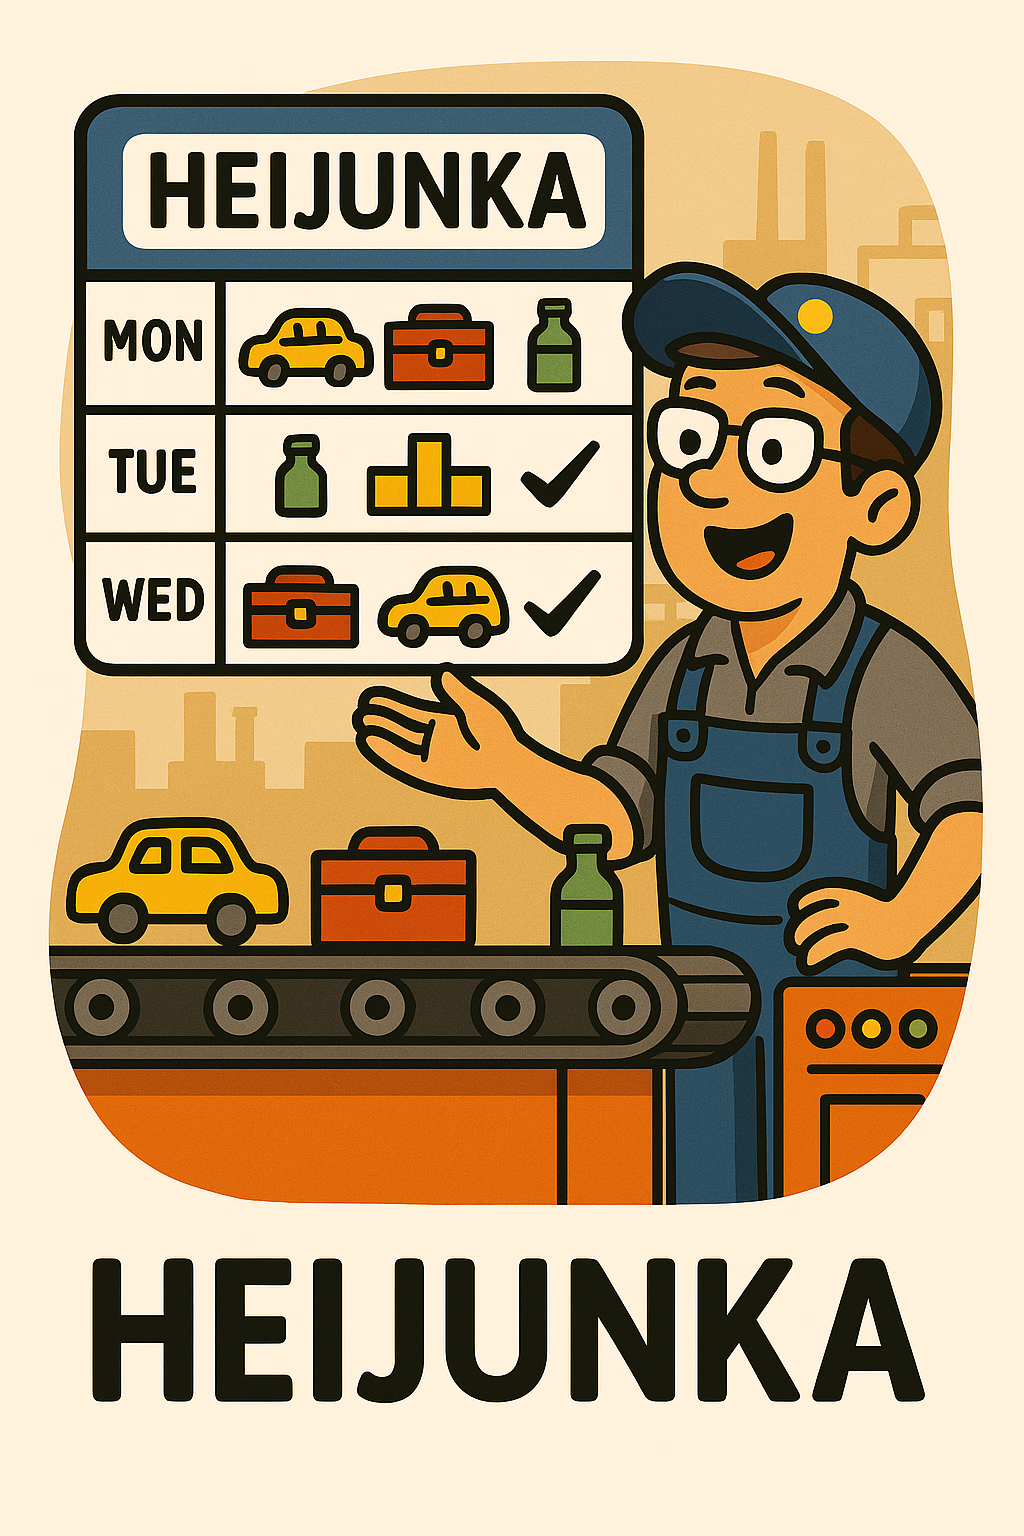
Heijunka (Production Leveling)
Heijunka is a method of leveling out production, in terms of both volume and mix, to create a steady flow that meets customer demand without big peaks and valleys. Instead of producing in large batches or responding to each order in isolation, Heijunka schedules production in a repeating sequence that evens out differences.
For example, if in a day you need to make 50 Product A and 50 Product B, a Heijunka schedule might alternate A and B in small increments (like ABBABA…) throughout the day, rather than 50 A followed by 50 B. By doing this, products are made in much smaller batches, and all product variants are made regularly.
Heijunka also refers to leveling by volume, smoothing out total production so each day (or hour) is roughly equal, rather than some periods of overwork and others of idleness. The benefit of Heijunka is reduced inventory (since you don’t produce huge batches that sit around) and shorter lead times for all products (since each type is made more frequently).
It should be used after initial improvements like 5S and flow are in place and when customer demand is understood. Implementing Heijunka often requires flexible processes and quick setups.
In essence, Heijunka takes the randomness out of production scheduling and replaces it with a stable, repetitive pattern that the upstream suppliers and processes can follow. This stability helps expose problems and creates a predictable workflow, which is the foundation for Just-In-Time.
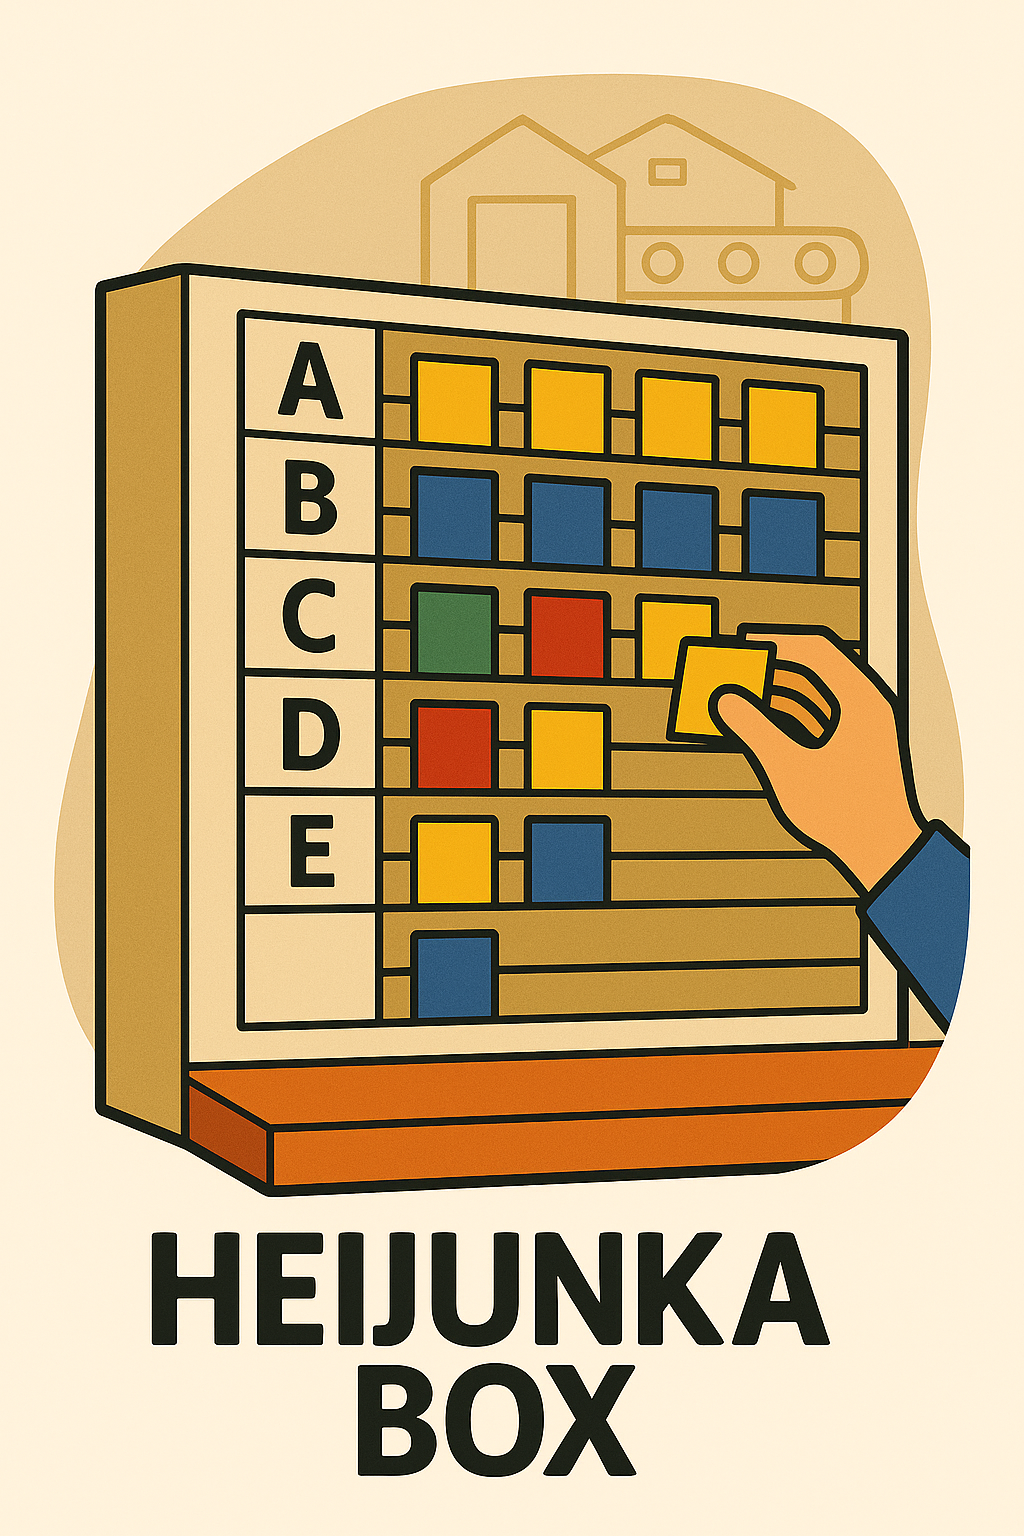
Heijunka Box
A Heijunka Box is a visual scheduling tool that helps execute level production. It’s literally a physical box or board, often with a grid of slots, that organizes Kanban cards (or work orders) according to a leveled schedule.
Each row of the heijunka box usually represents a product type, and each column represents a time interval (for example, a 30-minute interval or a day, depending on context). Cards are placed in the slots to indicate when a specific product should be produced.
By looking at the box, you can see a balanced mix of products over time. For instance, if you need to produce 4 Product A and 8 Product B per day, you might have a pattern in the Heijunka box that produces 1 A for every 2 B’s in a repeating sequence throughout the day.
The material handler or planner will periodically withdraw the cards column by column (say every 30 minutes) and deliver them to production, ensuring that in each period the right mix is made. This prevents large batches of one item and long gaps before another item’s production. The Heijunka box should be used as part of a pull system when you’re implementing Heijunka (leveling) in a production environment.
It makes the abstract concept of level scheduling concrete and easy to manage on the shop floor, everyone can see what to make and when, and that it’s been smoothed out. The result is a consistent work rhythm and a steadier output that matches customer demand with less inventory and chaos.
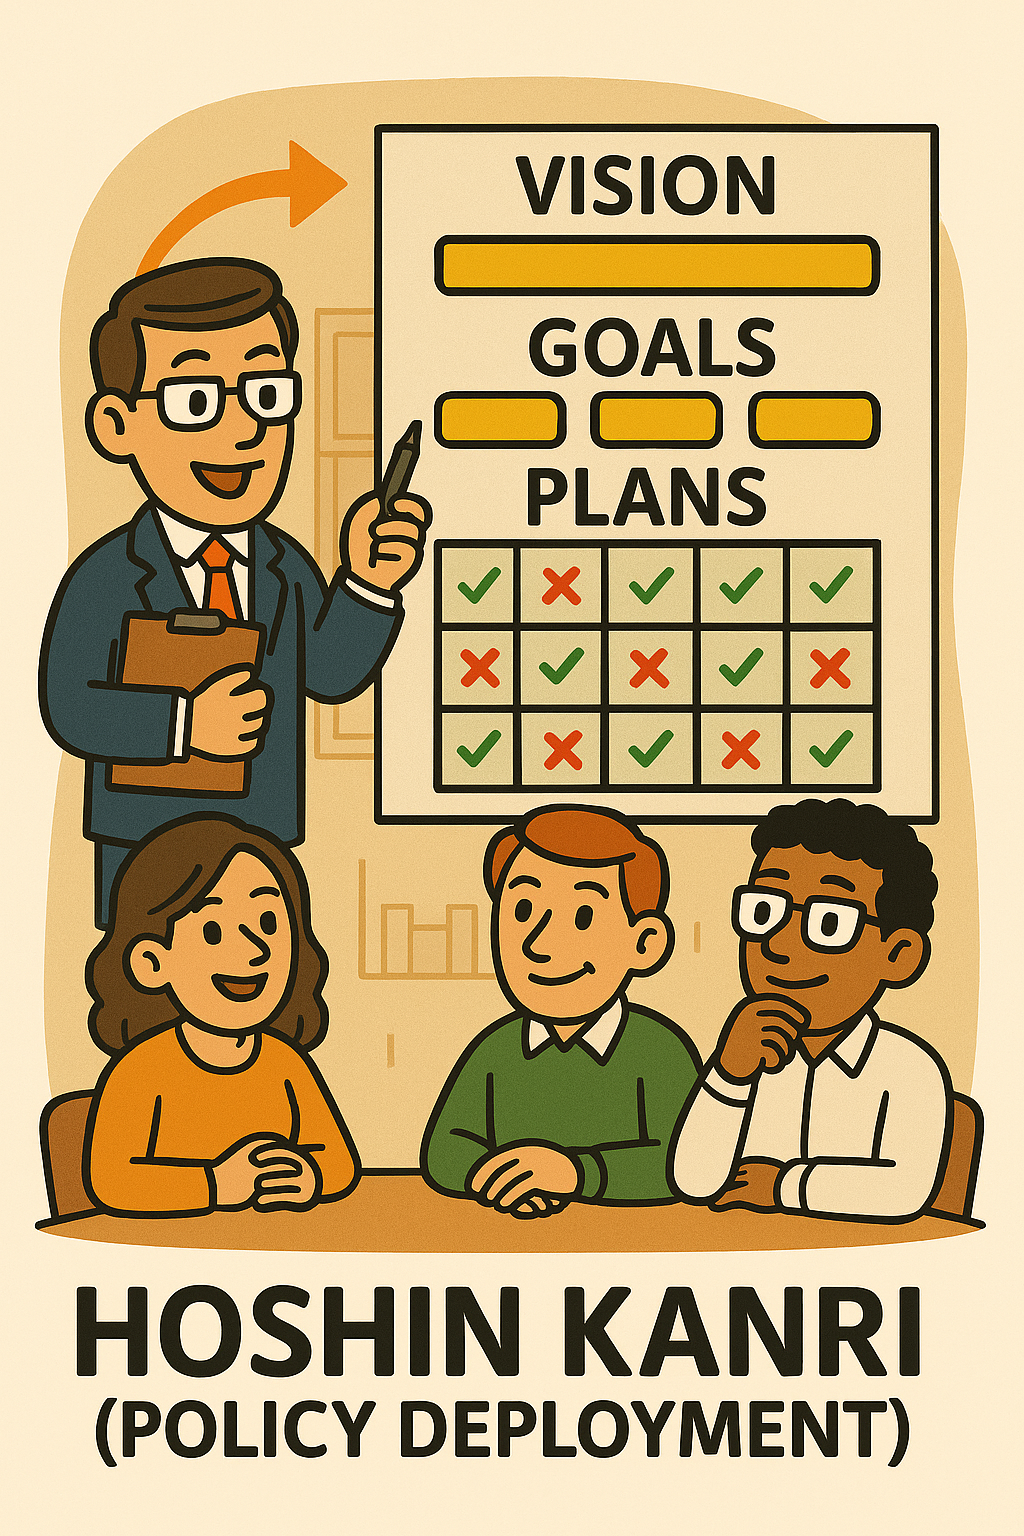
Hoshin Kanri (Policy Deployment)
Hoshin Kanri, also known as Policy Deployment, is a strategic planning and execution method that aligns the goals of the company (the “big picture”) with the plans and tasks of every level in the organization. The phrase means “direction management” hoshin = compass or direction, kanri = management.
In practice, top management sets a few key breakthrough objectives (e.g. a big quality improvement or cost reduction target for the year). Through Hoshin Kanri, these high-level goals are cascaded down by involving middle management and front-line teams in developing supporting plans so that each department and team knows its part in achieving the objectives.
A core part of Hoshin is the catchball process, a back-and-forth dialogue where objectives and plans are discussed up and down the hierarchy to ensure they are realistic and agreed upon. This process results in a set of aligned targets and initiatives at all levels (often captured in X-matrix or similar format).
You should use Hoshin Kanri during annual planning or whenever setting multi-month strategic initiatives, to replace the old model of disconnected departmental goals. It ensures that daily work (the “gemba” actions) are contributing to the company’s strategic objectives, eliminating waste from misdirected efforts and poor communication.
In short, Hoshin Kanri is the Lean way to deploy strategy: everyone pulls in the same direction because the goals are shared and methodology to get there is agreed upon, with regular check-ins to track progress.
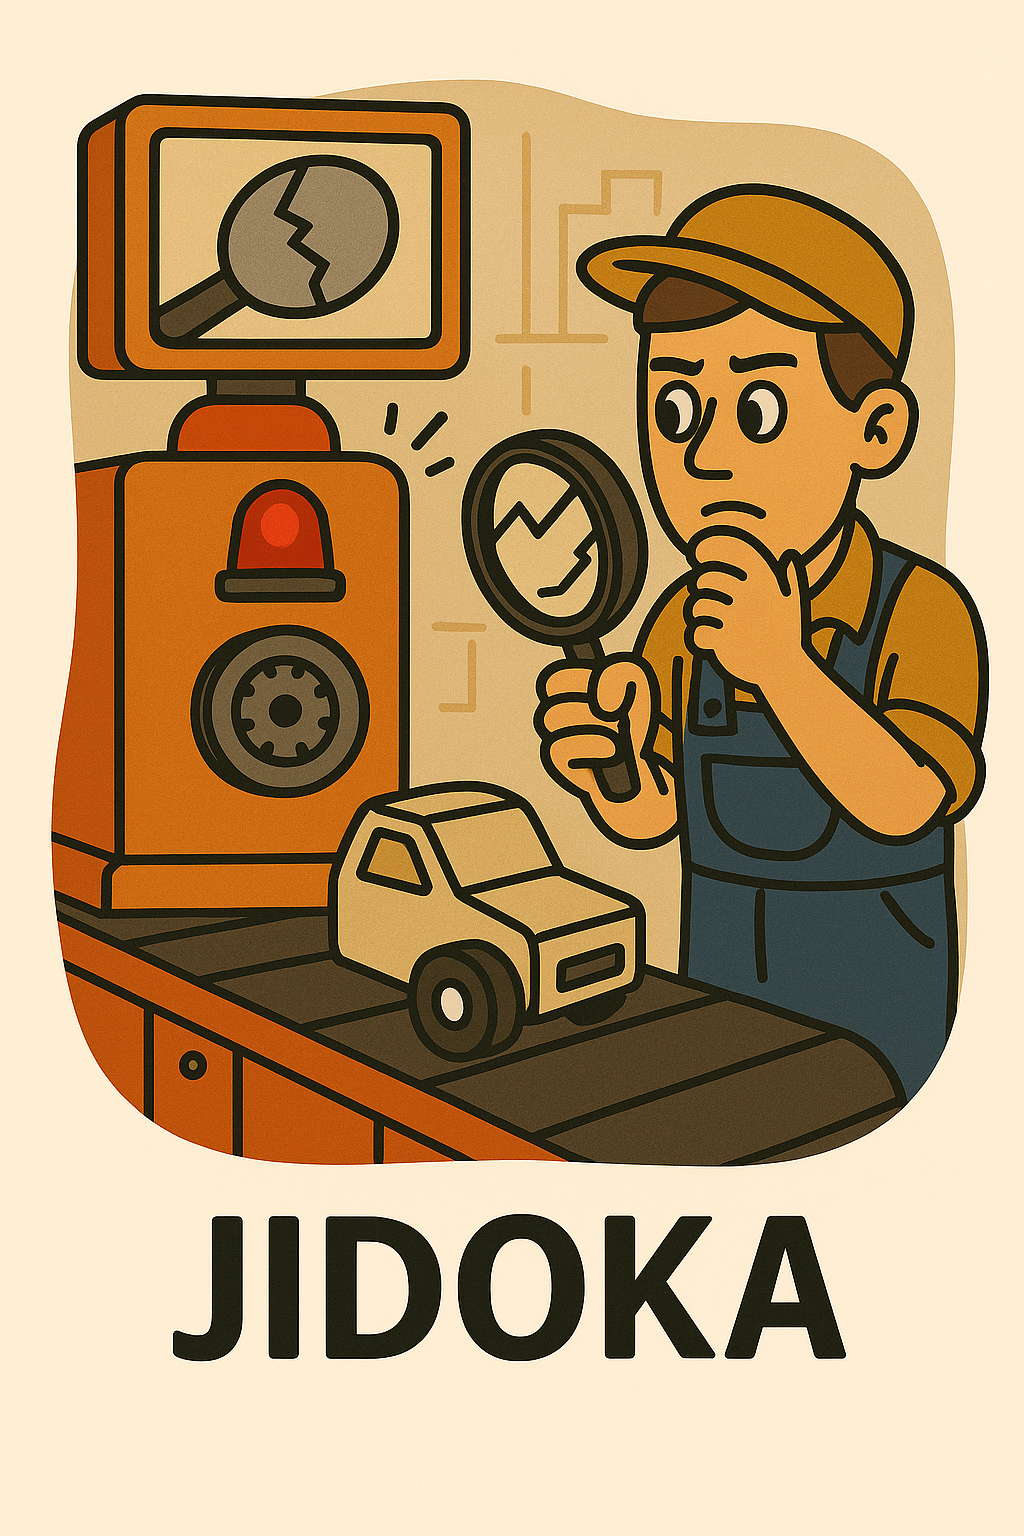
Jidoka
Jidoka is a Japanese term meaning “automation with a human touch”, and it refers to the Lean principle of building quality into the process by stopping automatically whenever a defect or abnormality occurs. In practice, Jidoka can be seen in machines that have sensors to detect problems (like a part stuck in a feeder or a tool out of spec) and then halt operation so the issue can be fixed.
It also empowers operators to stop the production line if they notice something wrong, rather than passing a defect onward. By doing so, defects are caught at the source and you avoid making a bunch of faulty products.
One simple example: a sewing machine that automatically stops if the thread breaks, preventing a whole garment from being sewn incorrectly. Or in assembly, a worker noticing a misaligned part pulls an Andon cord to stop the line and call for help, this is Jidoka in action.
The philosophy behind it is don’t allow defects to continue, and it’s equally about equipment design and human process. Jidoka should be implemented when you want to improve quality and reduce rework; it might involve adding mistake-proofing devices (poka-yoke), sensors, or procedures that pause work until resolution.
The result of Jidoka is higher quality, but it also forces continuous improvement: each stop is analyzed, the root cause is fixed, and then the line runs better. It’s one of the pillars of the Toyota Production System, combining with Just-In-Time to form a robust Lean system.
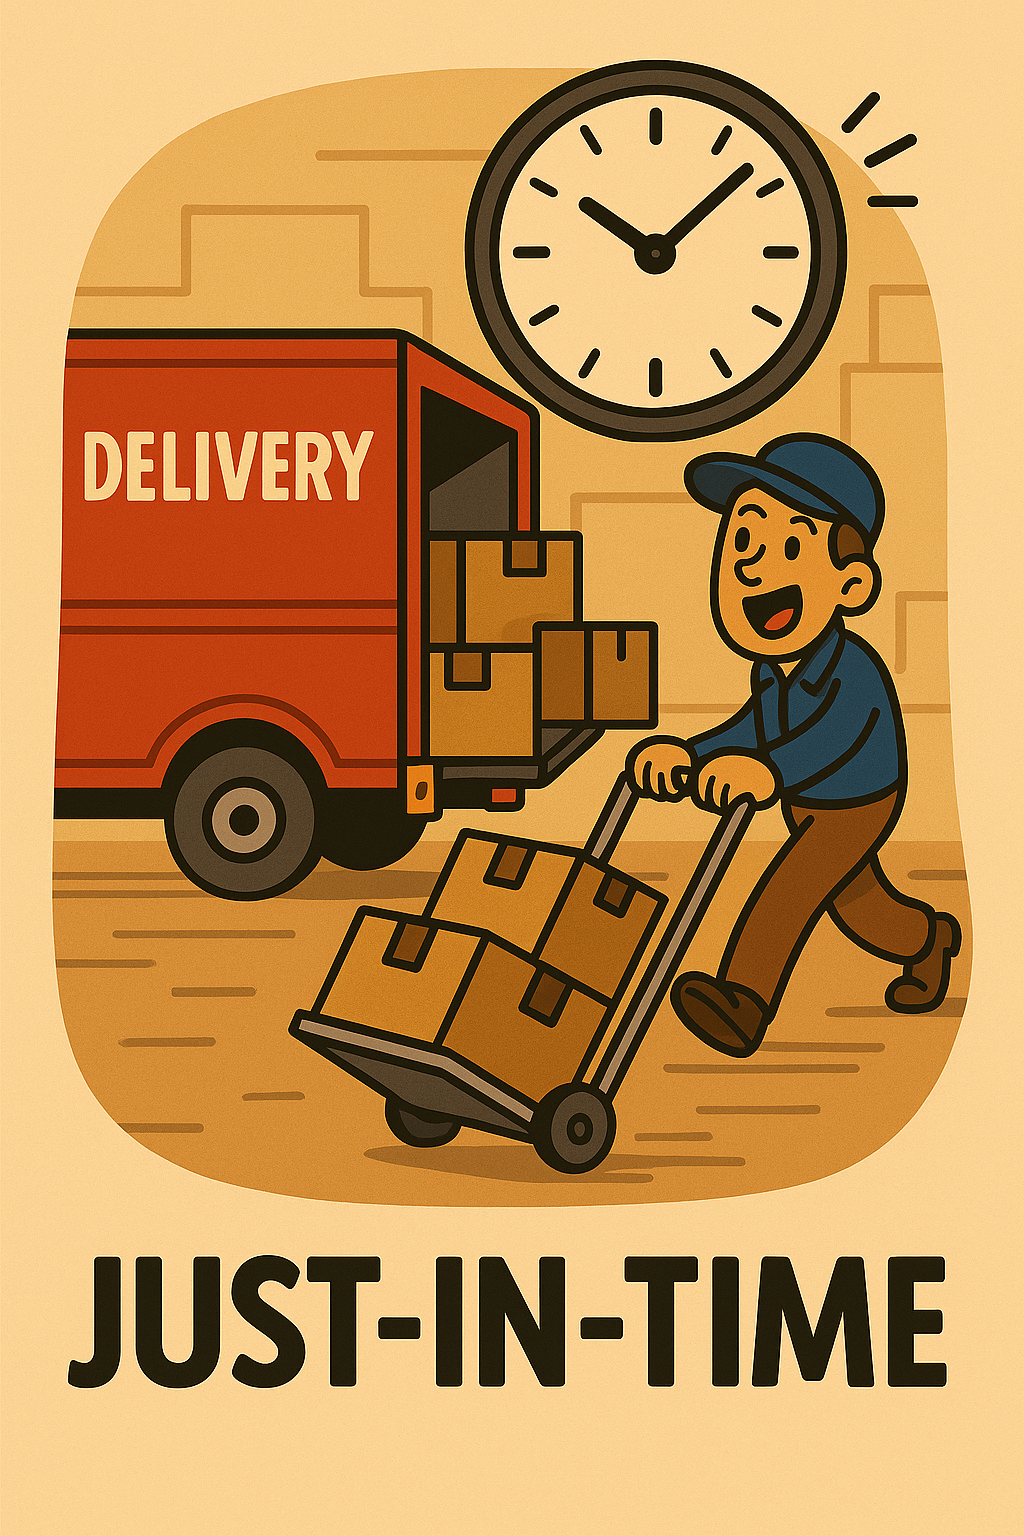
Just-In-Time (JIT)
Just-In-Time (JIT) is a key pillar of lean manufacturing. It is a production and inventory management strategy where each process produces only what is needed, when it’s needed, and in the quantity needed, nothing more, nothing less. Instead of building up big stocks based on forecasts, JIT uses actual customer demand signals (often conveyed by Kanban cards or similar) to pull materials and products through the system.
For example, in a JIT factory, if the customer orders 10 units of Product X today, the production will make 10 (not 50 “just in case”), and materials for those 10 will arrive just as they are required, not weeks in advance. The goal is to eliminate waste from overproduction, excess inventory, and waiting time.
To make JIT work, several Lean tools come into play: takt time to pace production to demand, heijunka to level the mix and volume, Kanban systems to signal restocking, and very short setup times (SMED) to be able to switch frequently.
JIT should be the guiding principle once processes are stable enough, it’s essentially the vision of Lean where you produce and deliver exactly on time.
A beginner example might be on a small scale: only buying raw materials when you have a customer order in hand for the finished product, rather than maintaining a huge raw stock “just in case”.
JIT is highly efficient but requires discipline and trust in the system because there’s little buffer, issues become immediately visible. When successfully applied, JIT results in lower inventory costs, fresher products (or less obsolescence), and quicker response to customer orders.
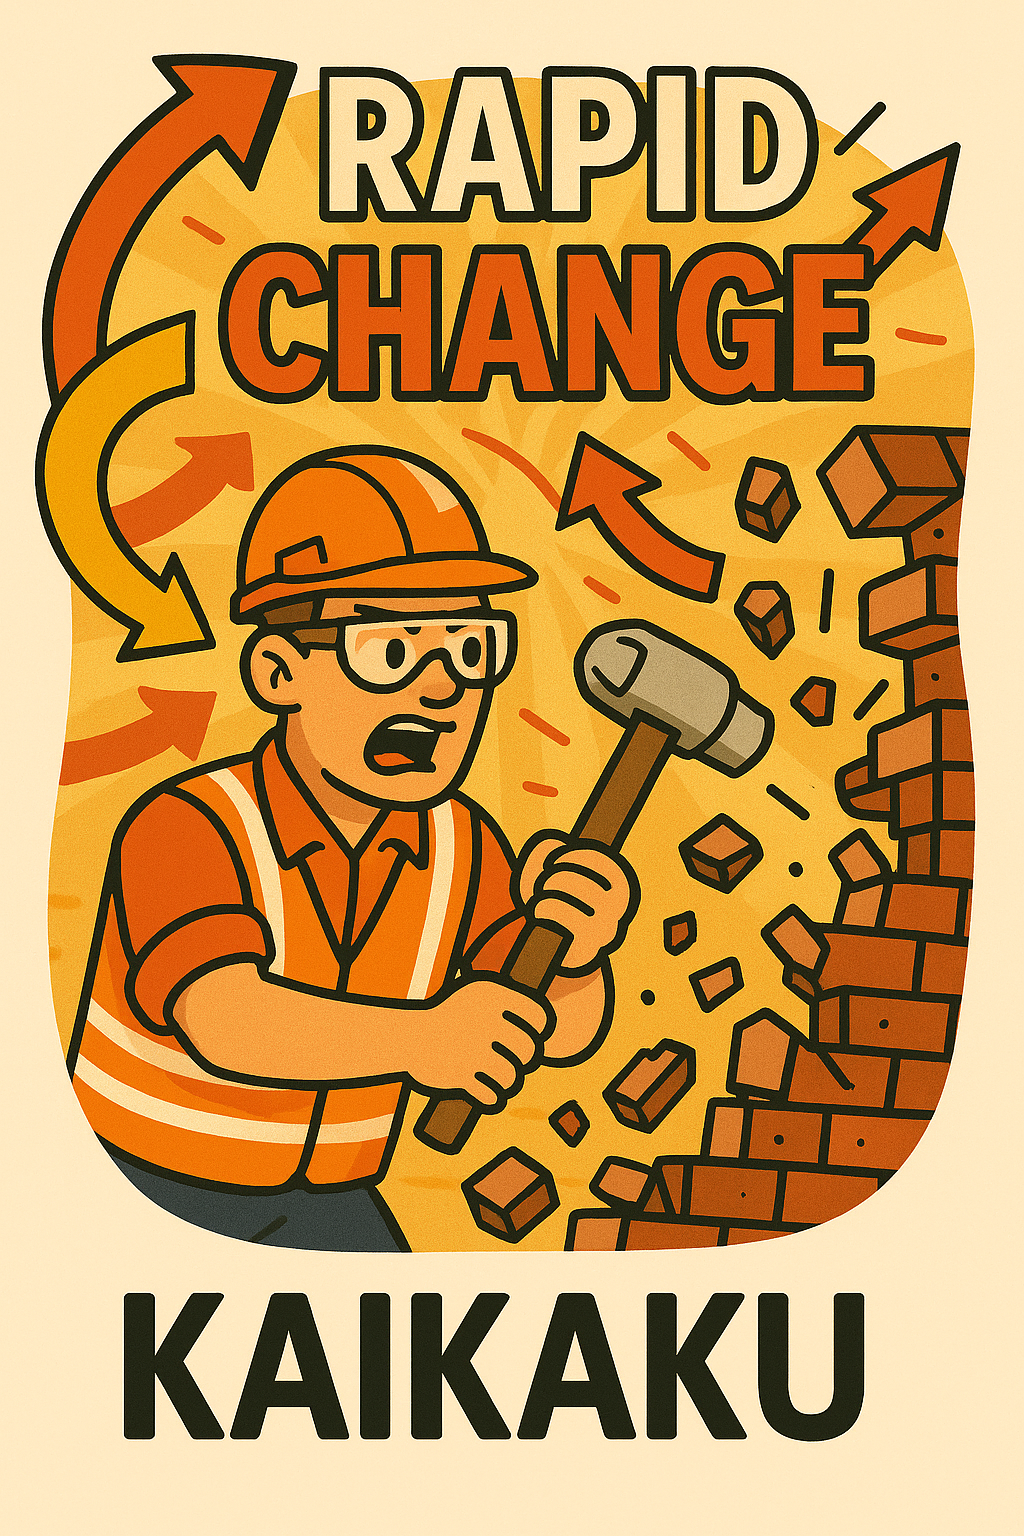
Kaikaku
Kaikaku means “radical change” or breakthrough improvement in Japanese. It’s the Lean concept of making significant, often one-time, revolutionary changes to a process or value stream to achieve a big jump in performance.
While Kaizen is about continuous small improvements, Kaikaku is about big leaps, think of restructuring a production line entirely, introducing a brand new technology, or completely rethinking how a service is delivered.
For example, if a factory has always built products in a batch-and-queue manner, a Kaikaku might be reconfiguring everything into one-piece flow cells over a short period (like a single intense event), resulting in major reductions in lead time and inventory at once.
Kaikaku often involves a paradigm shift and may be driven by top management or a crisis needing drastic action (sometimes also called “breakthrough Kaizen” to link it to Kaizen conceptually). You should consider Kaikaku when incremental tweaks aren’t enough, perhaps your process is fundamentally outdated or far off from where it needs to be to satisfy customers.
It can be disruptive in the short term because it’s a big change (unlike gentle Kaizen), but it can quickly create more value with less waste. Use Kaikaku sparingly and deliberately: it’s like an overhaul to set a new, higher standard, after which continuous Kaizen can resume to refine further. In sum, Kaikaku is the bold transformation tool in Lean’s toolbox.
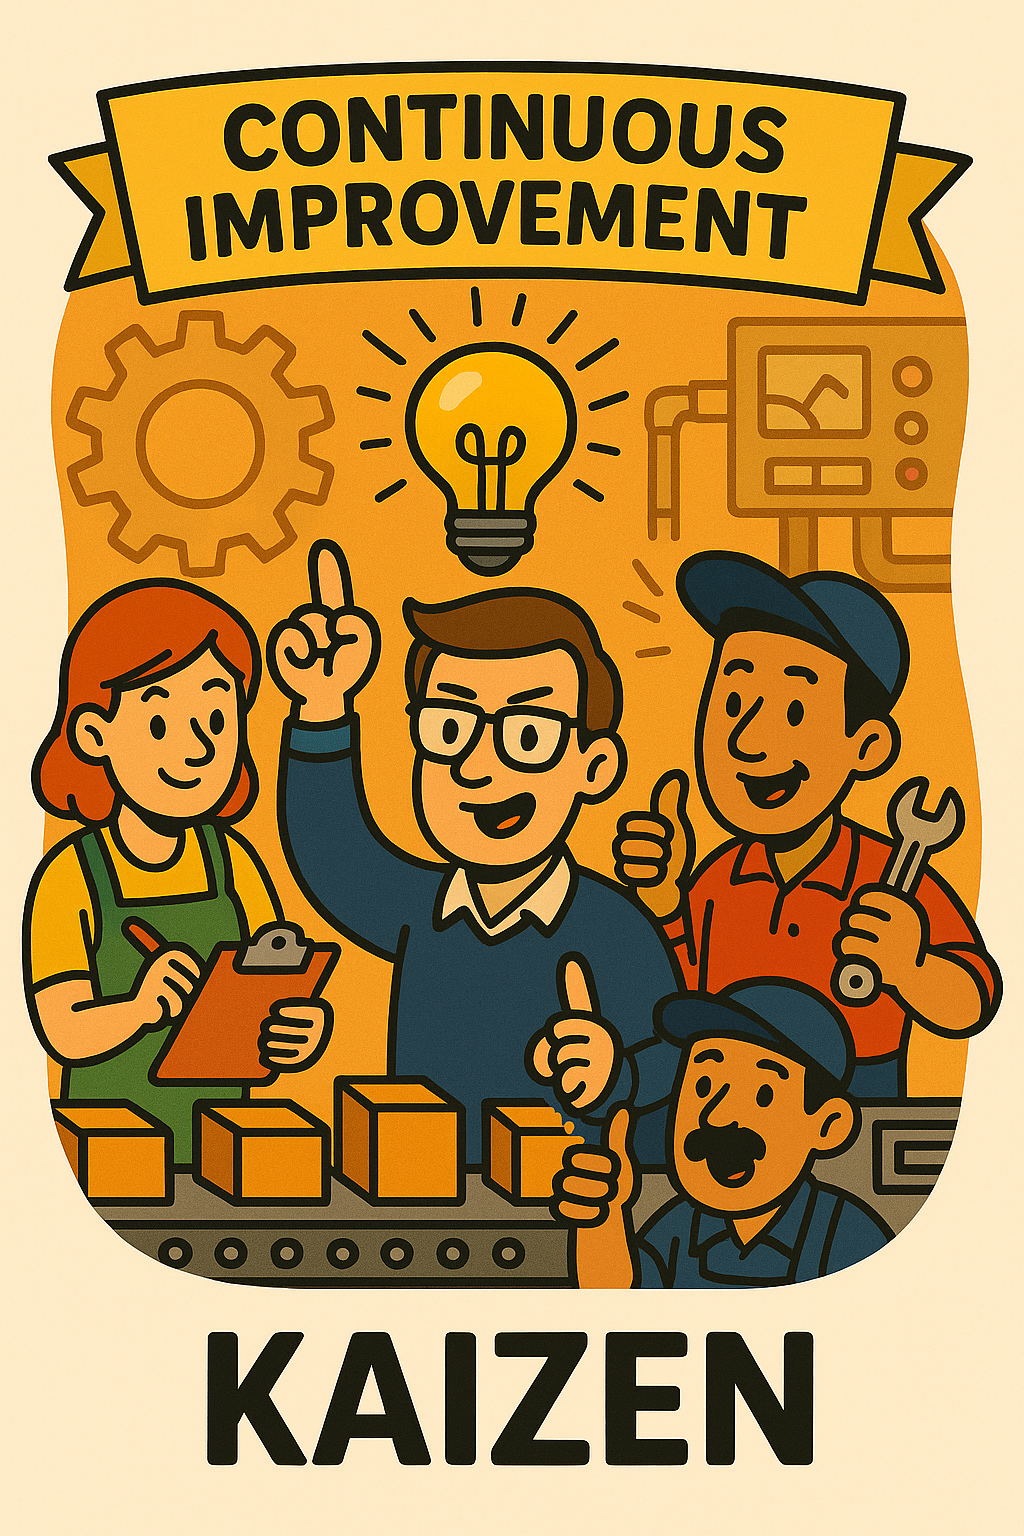
Kaizen (Continuous Improvement)
Kaizen is the philosophy of continuous improvement through small, incremental changes that add up over time. The word is Japanese for “change for the better.” In practice, Kaizen involves everyone in the organization, from management to front-line workers, proactively looking for opportunities to streamline tasks, reduce waste, and improve quality or efficiency on a daily basis.
It can be as simple as a worker suggesting a new placement for a tool to save a few seconds, or a team rearranging steps in a process to reduce waiting. Kaizen can happen informally (individuals making tweaks in their own work) or formally through Kaizen events (short workshops where a team focuses on improving a specific process).
The core idea is that the people doing the work often have the best ideas for improvement, and no improvement is too small. When something goes wrong, the Kaizen mindset is to investigate why and make a change so it doesn’t happen again.
Over time, hundreds of these small improvements compound into big benefits for the company. Kaizen should be part of the culture, it’s not a one-time thing, but a continuous cycle of Plan-Do-Check-Act in everyday work.
Newcomers to Lean are often introduced to Kaizen early on, because it empowers everyone to participate and shows that Lean is not just top-down. By relentlessly making things a little better each day, organizations become more agile, efficient, and engaged.
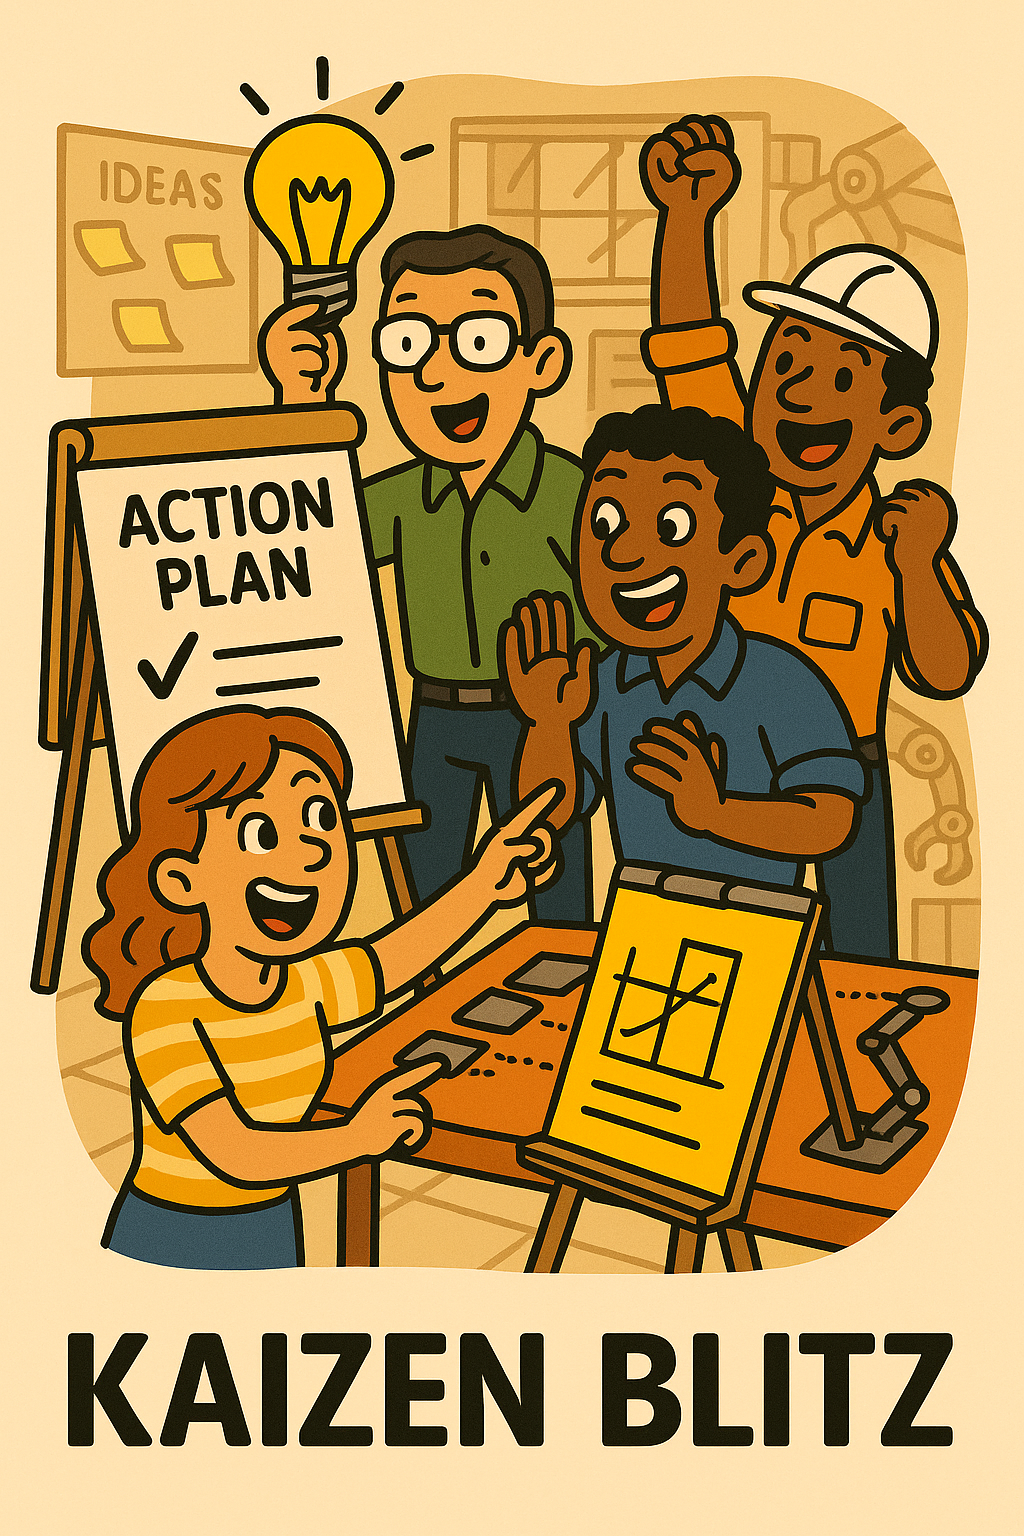
Kaizen Blitz (Kaizen Event)
A Kaizen Blitz, also known as a Kaizen Event or Rapid Improvement Event, is an intensive, short-term project where a cross-functional team focuses on rapidly solving a specific problem or improving a particular process within a few days.
Typically lasting 3 to 5 days, a kaizen blitz involves steps similar to DMAIC but in a compressed timeframe: the team defines the problem and goals, measures current performance, analyzes root causes, implements improvements, and sets up controls, all in that brief period.
For example, a warehouse might hold a kaizen event to reorganize the picking area for efficiency; over three days the team will map the current state, identify wasted motions, test a new layout, implement it, and measure the improvement by the end of the event. Kaizen blitzes are very action-oriented, the motto is “implement now and refine later”.
They are useful when a process is clearly in need of change and you want quick results or a jump-start to continuous improvement. They also serve to train team members in Lean thinking by doing it.
A key to success is having management support to quickly remove barriers (like authorizing changes or purchases on the spot) and dedicating the team full-time during the blitz. Use kaizen blitzes to tackle contained issues where you can involve those who do the work; it builds momentum and shows what’s possible, often achieving in days what might otherwise drag on for months.
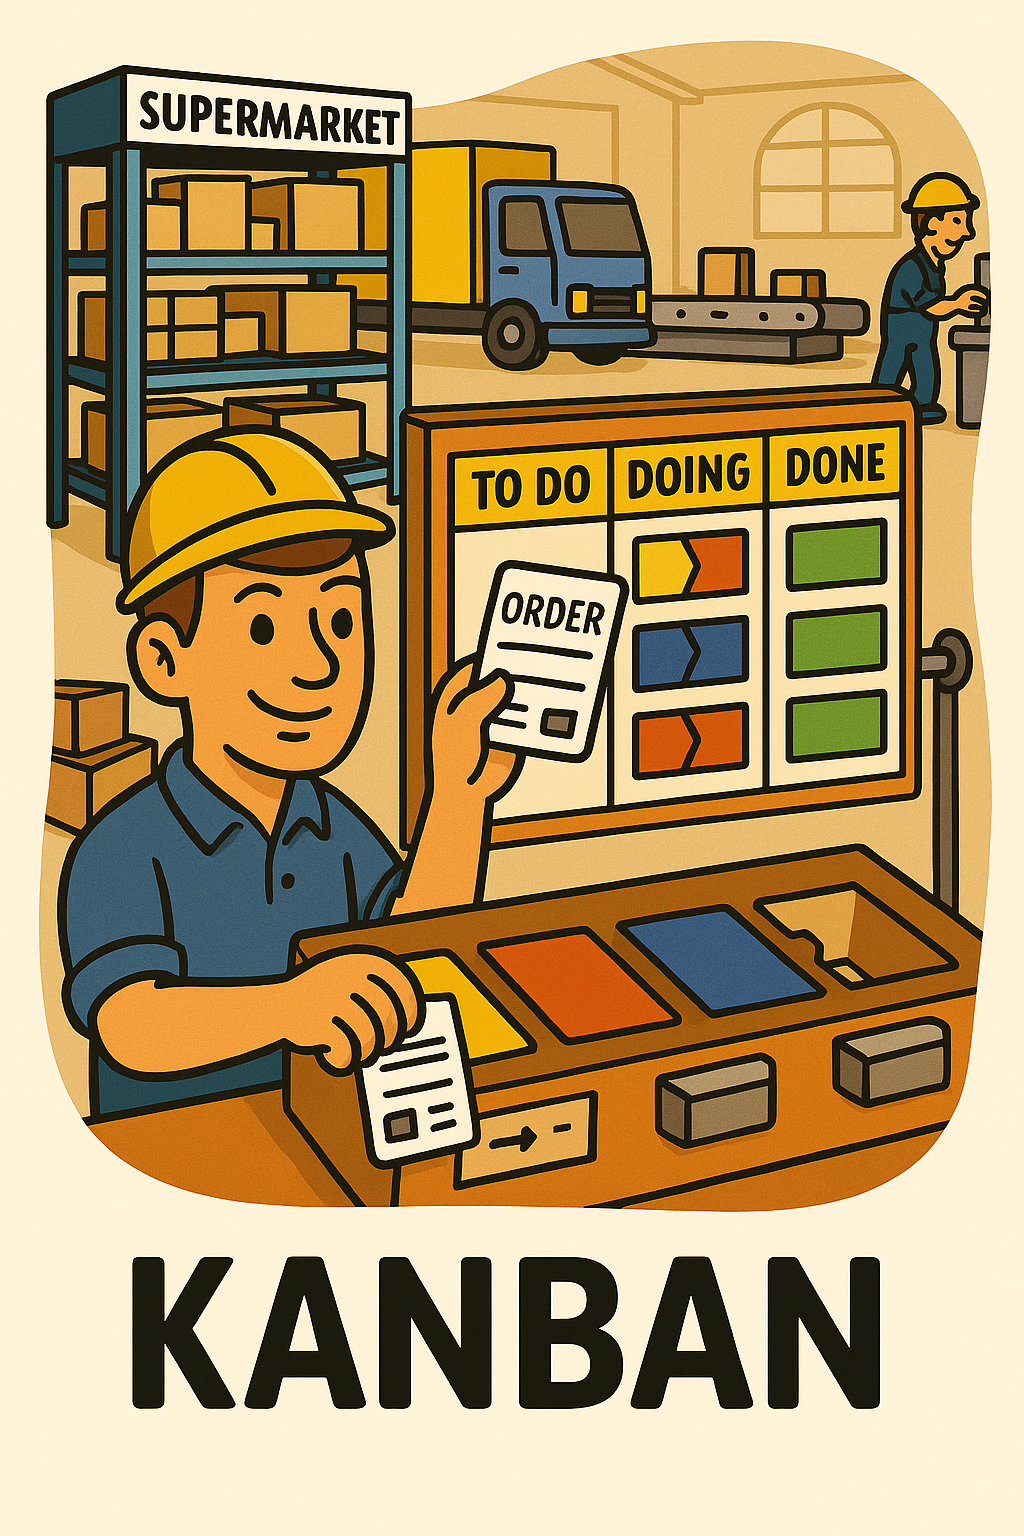
Kanban
Kanban is a visual system for managing work in a pull-based process. The term means “sign” or “signboard” in Japanese, and in Lean it usually refers to cards or signals that control the flow of materials and production based on consumption.
A classic example is a Kanban card in a bin of parts, when the bin’s quantity goes below a certain point, the card is sent back to the supplying process as an instruction to make more. In this way, no new work is done unless there is a downstream need for it.
Kanban can also be seen on task boards in knowledge work (like sticky notes on a To-Do/Doing/Done board, which visually show the status of work items). The core principle is that each process pulls what it needs from the previous one, rather than pushing output regardless of need.
Implementing Kanban requires setting appropriate container sizes or lot sizes and limits on how many Kanbans (thus how much inventory) are allowed in the system. You should use Kanban to eliminate overproduction and reduce inventory: it creates an automatic linkage between consumption and production, providing real-time feedback.
When properly in place, Kanban improves responsiveness (you make what customers actually want) and highlights problems (if a process can’t keep up with Kanban signals, it exposes capacity issues or interruptions). In summary, Kanban is the nervous system of Just-In-Time, simple visual signals that say “make more of this now” or “move these materials now” based on actual usage, thereby aligning production tightly with demand.
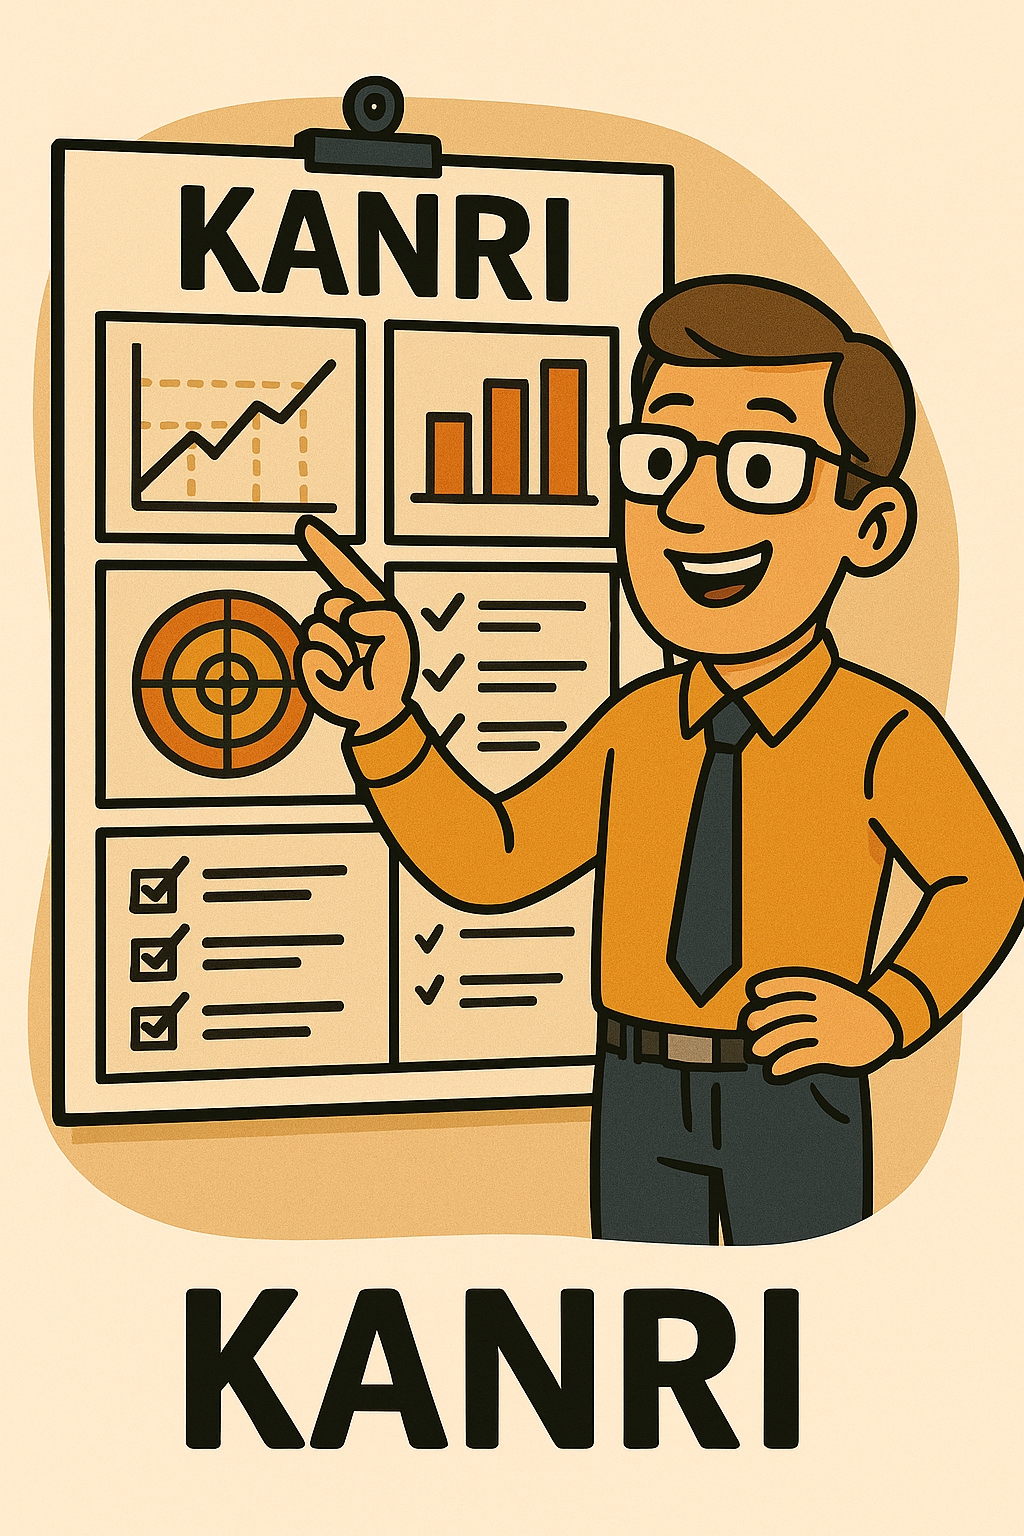
Kanri (Management)
Kanri is a Japanese word meaning “management” or “control.” In Lean contexts, it often refers to the systems and processes for managing ongoing operations and sustaining improvements. For example, in Hoshin Kanri (policy deployment), kanri denotes the management of policies or goals throughout the company.
In daily work, you might hear about “daily management” or nichijo kanri, which is making sure that processes are performing as expected each day and that standard work is followed. Essentially, Kanri is the management discipline of PDCA at a broader scale: setting targets, monitoring performance, responding to deviations, and continuously improving how work is managed.
Another usage is in terms like Visual Kanri, referring to visual management boards that help control work. You should think of Kanri as the counterpart to Kaizen, if Kaizen is about improvement, Kanri is about maintaining and controlling.
A simple example is a team leader’s checklist for each shift (ensuring all tasks are done, checking safety, etc.), which is a Kanri tool to sustain 5S or other improvements. Use “Kanri” approaches to ensure that after making changes, you don’t slip back into old habits.
As one Lean dictionary put it, kanri is administration or control, it makes Lean changes stick by formalizing responsibilities and processes so the new way becomes the normal way.
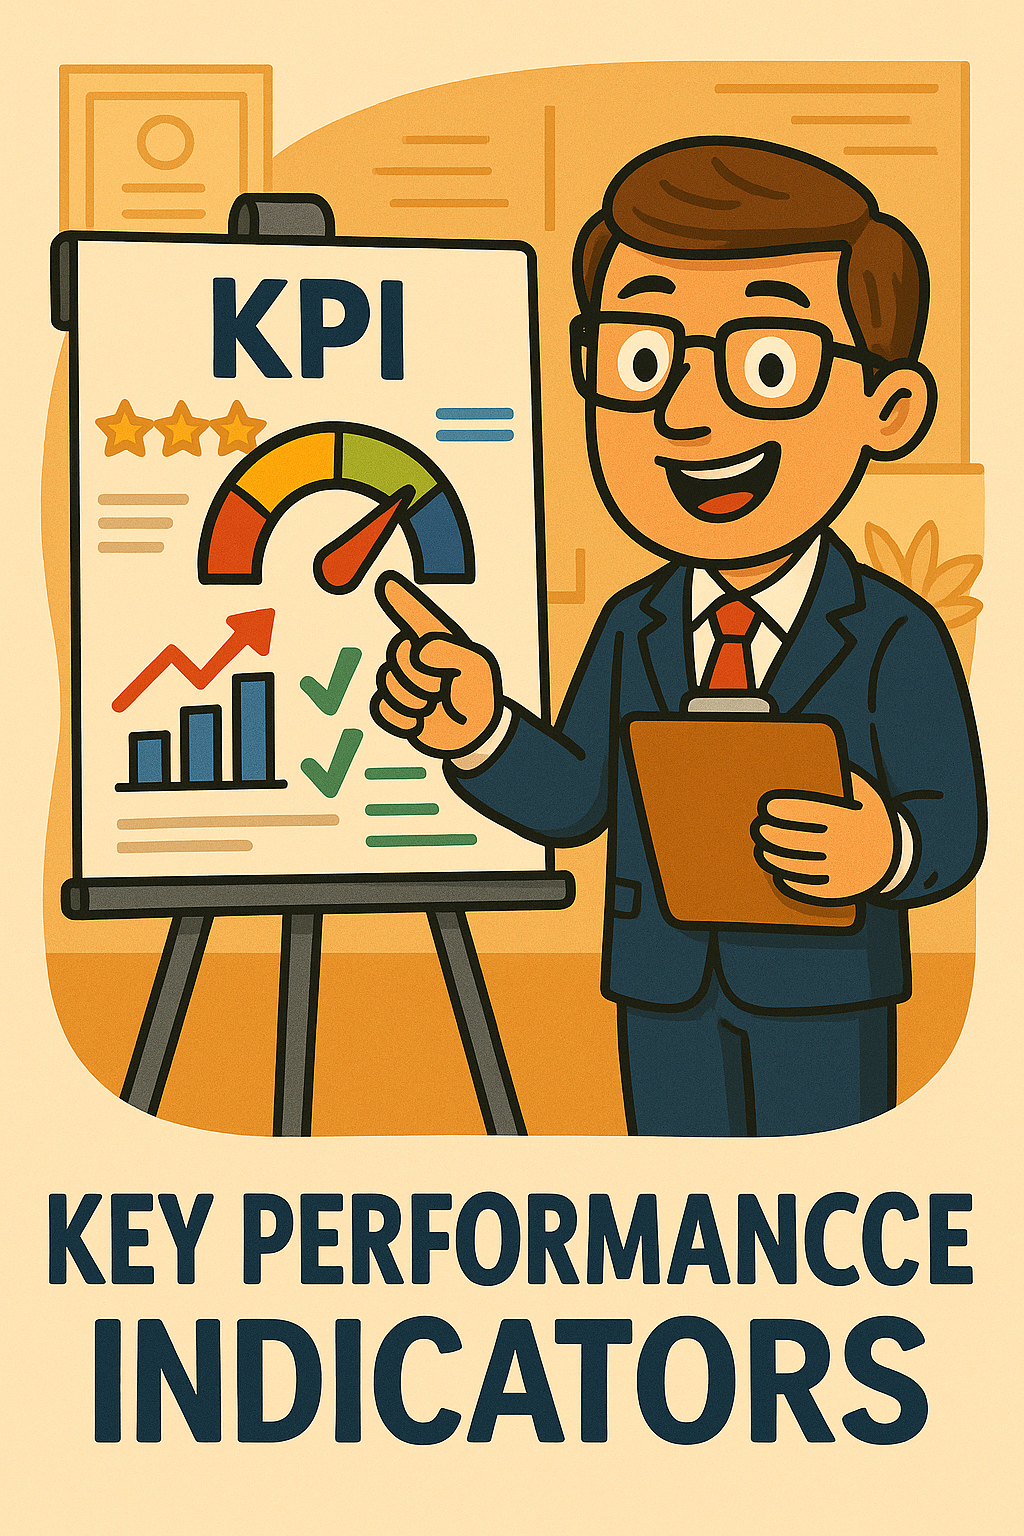
Key Performance Indicators (KPIs)
Key Performance Indicators (KPIs) are specific, measurable metrics that an organization uses to track its performance against its critical goals. In Lean, KPIs are chosen to reflect areas like:
Quality (e.g defect rate);
Delivery (e.g on-time shipments);
Cost (e.g unit cost);
Safety (e.g incident rate);
Morale (e.g employee suggestions);
A good KPI should be aligned with what truly matters to the business or customer, for example, if customers care a lot about lead time, then “order-to-delivery days” might be a key indicator. KPIs are used to make results visible and to motivate improvement.
In a Lean management system, KPIs are often displayed on team boards or dashboards and reviewed regularly (daily, weekly, monthly) in stand-up meetings. It’s important to select KPIs carefully: as the saying goes, “What gets measured gets managed,” so you want to ensure the metrics encourage the right behavior.
For instance, measuring output quantity alone might inadvertently encourage overproduction unless balanced with an inventory or quality metric. When you set up KPIs, also set targets (e.g. improve first-pass yield from 95% to 99% in six months) and ensure each KPI has an owner who monitors it.
For beginners, start with a handful of KPIs that link to your customer’s priorities or your company’s goals (like a Balanced Scorecard approach covers multiple dimensions). By tracking KPIs, teams can see if their improvements are working and leaders can steer the organization effectively based on real data.
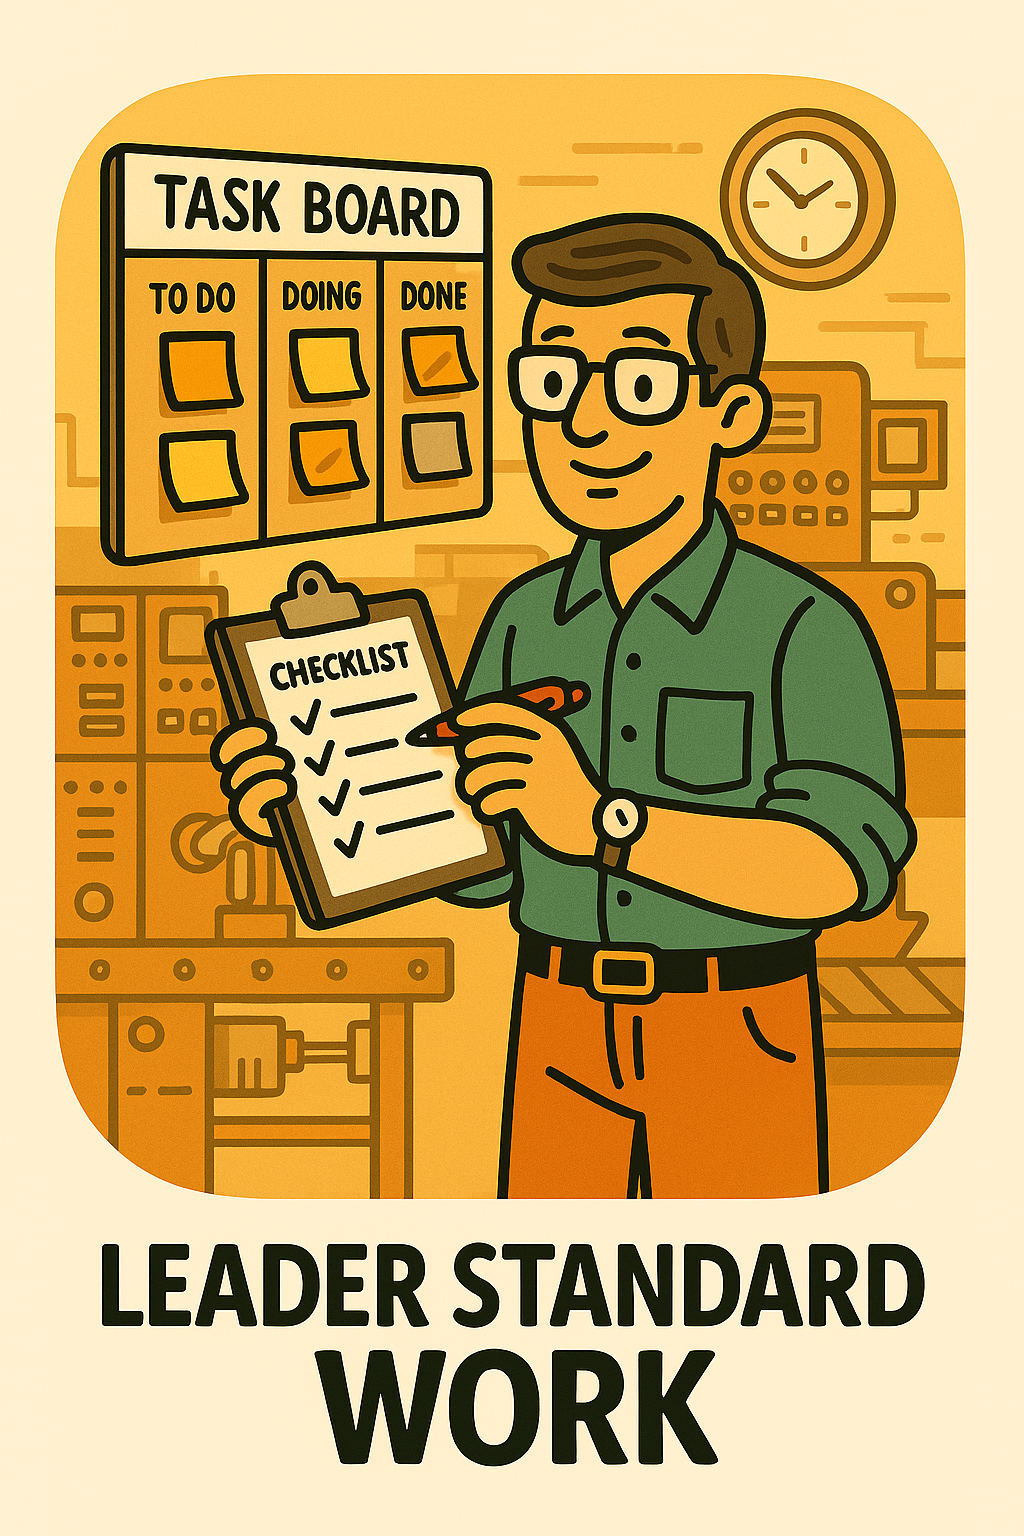
Leader Standard Work
Leader Standard Work (LSW) is the practice of defining and following a routine set of activities that leaders (supervisors, managers, etc.) carry out daily or weekly to support a Lean system. Just as operators have standardized work for how to perform tasks, leaders have standard work for how to manage.
This might include things like: a daily Gemba walk at 9:00am to check on key processes, a 15-minute morning meeting with the team to review safety and yesterday’s performance, a weekly audit of 5S conditions, a check of the Kanban cards or board at midday, and a monthly strategy review meeting.
The idea is that leaders’ duties in a Lean environment should be as routine and disciplined as any other process, focusing on coaching, removing obstacles, and verifying that standards are followed. By having Leader Standard Work, leaders ensure they are spending time on what’s important (like development of people, problem-solving, and process confirmation) rather than just fighting fires randomly.
It also creates consistency: if every shift supervisor has standard work to check critical quality points twice a day, you can be confident that problems will be caught early. You should implement Leader Standard Work once basic processes and metrics are in place, as a way to sustain improvements.
For example, after a kaizen event, part of the control might be adding a leader check into their routine. It might feel “scripted” at first, but it actually frees leaders to be proactive instead of reactive. In summary, Leader Standard Work is a checklist or schedule of leadership behaviors that, when done consistently, keep the system healthy and continuously improving.
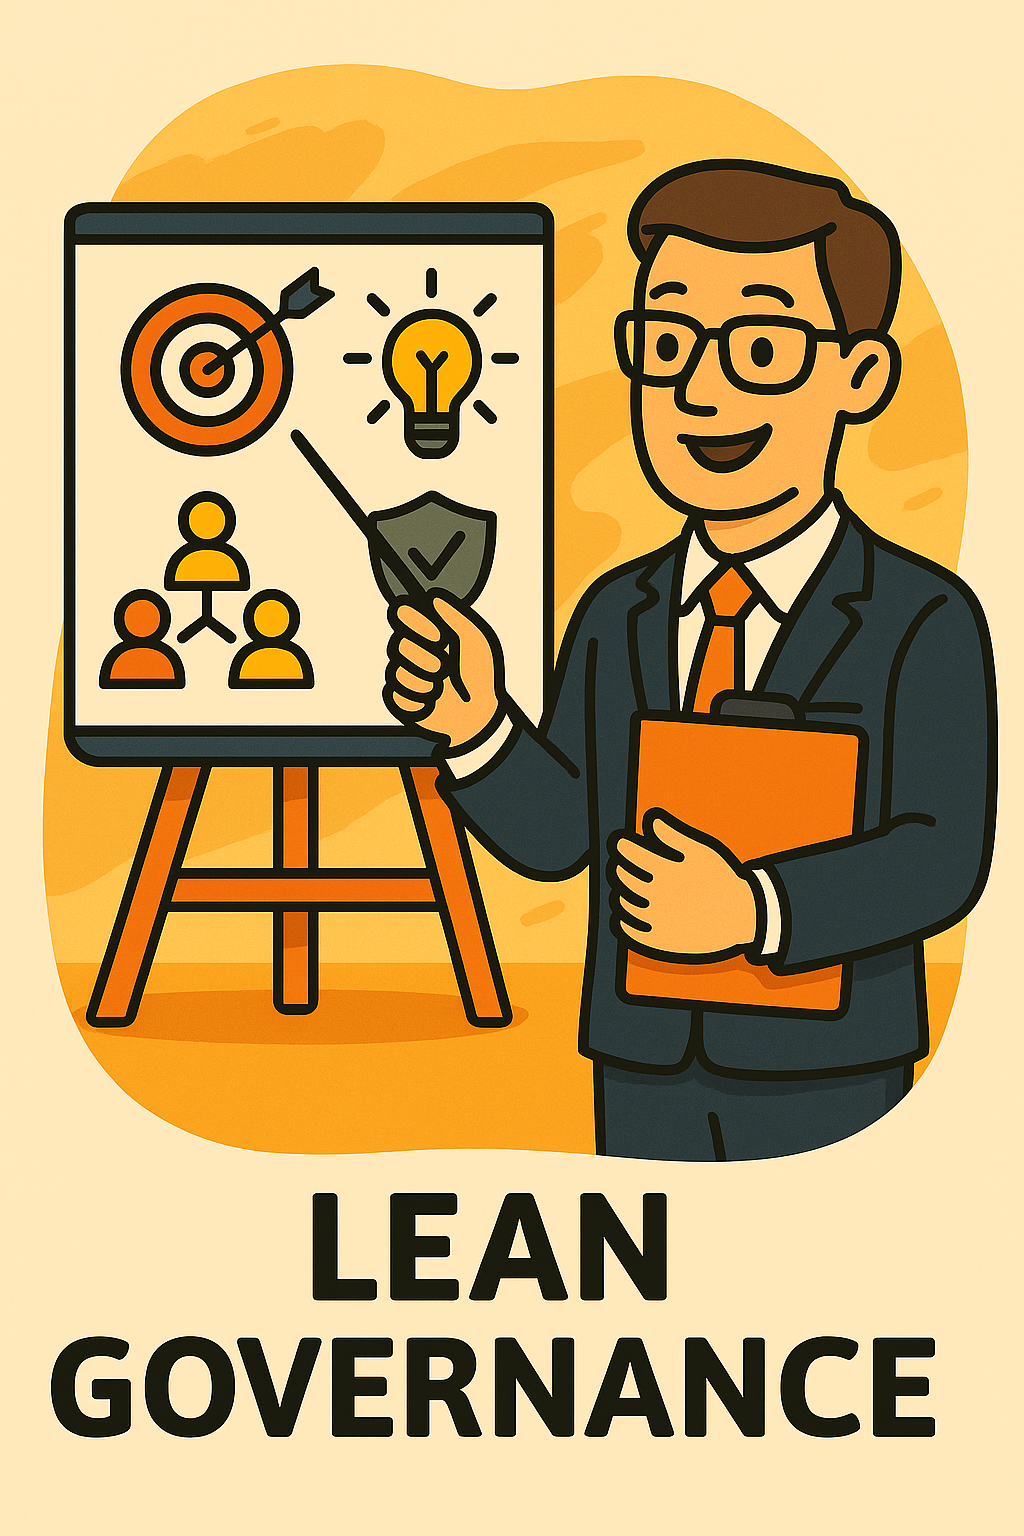
Lean Governance
Lean Governance refers to applying Lean principles to the governance and management structures of an organization. In traditional terms, governance involves how decisions are made, how performance is monitored, and how compliance or strategic alignment is ensured.
Lean Governance seeks to do this with minimal bureaucracy and maximal effectiveness. It’s about creating leadership and organizational processes that enable everyone to work together smoothly to deliver value, rather than slowing things down.
For instance, instead of having five layers of approvals for a project (which could cause waiting waste), a Lean governance model might delegate decision-making to lower levels within agreed-upon boundaries, trusting the teams and only requiring exceptions to escalate.
Lean Governance often involves setting up clear visual management of goals and status (so it’s transparent how the organization is doing), regular but efficient check-ins (like brief huddle meetings rather than long report-outs), and a focus on removing barriers for teams. It’s also about alignment, for example, using Hoshin Kanri to ensure strategy is communicated and everyone’s executing the plan, which is a governance mechanism.
You would practice Lean governance by having simple and consistent processes for things like budgeting, project selection, and performance reviews that emphasize quick feedback and learning rather than heavy control. The benefit is that the company can adapt faster (because decision loops are shorter) and teams feel empowered yet still guided by clear principles.
In short, Lean Governance is “just enough governance” providing the necessary oversight and direction but without the wasteful overhead of committees and paperwork that don’t add value.

Lean Reading Group
A Lean Reading Group is an informal gathering of people (often within a company or a professional community) who regularly meet to read and discuss books or articles on Lean thinking, continuous improvement, or related topics. The idea is to collectively deepen understanding of Lean principles and share insights on how they might apply to one’s own work.
For example, a Lean reading group might pick a popular Lean book like “The Goal” or “Toyota Kata” and assign one chapter per week. During weekly sessions (which could be in-person during lunch or virtual meetings), members discuss key points, ask questions about parts they found confusing, and share experiences that relate to the reading.
This practice is beginner-friendly, it’s a safe space to learn Lean concepts and terminology by talking them through with peers. It should be used as a development tool: If a company is trying to build a Lean culture, having a reading group can accelerate knowledge transfer and get everyone on the same page philosophically. It also encourages reflection, sometimes someone from accounting will interpret a Lean concept differently than someone from manufacturing, and through discussion, they both gain a broader perspective.
There’s no “output” of a reading group beyond learning, but that learning can translate into new improvement ideas or more cohesive Lean efforts. In sum, a Lean Reading Group is like a book club for continuous improvement enthusiasts, it makes learning ongoing and social, which often improves retention and sparks enthusiasm.
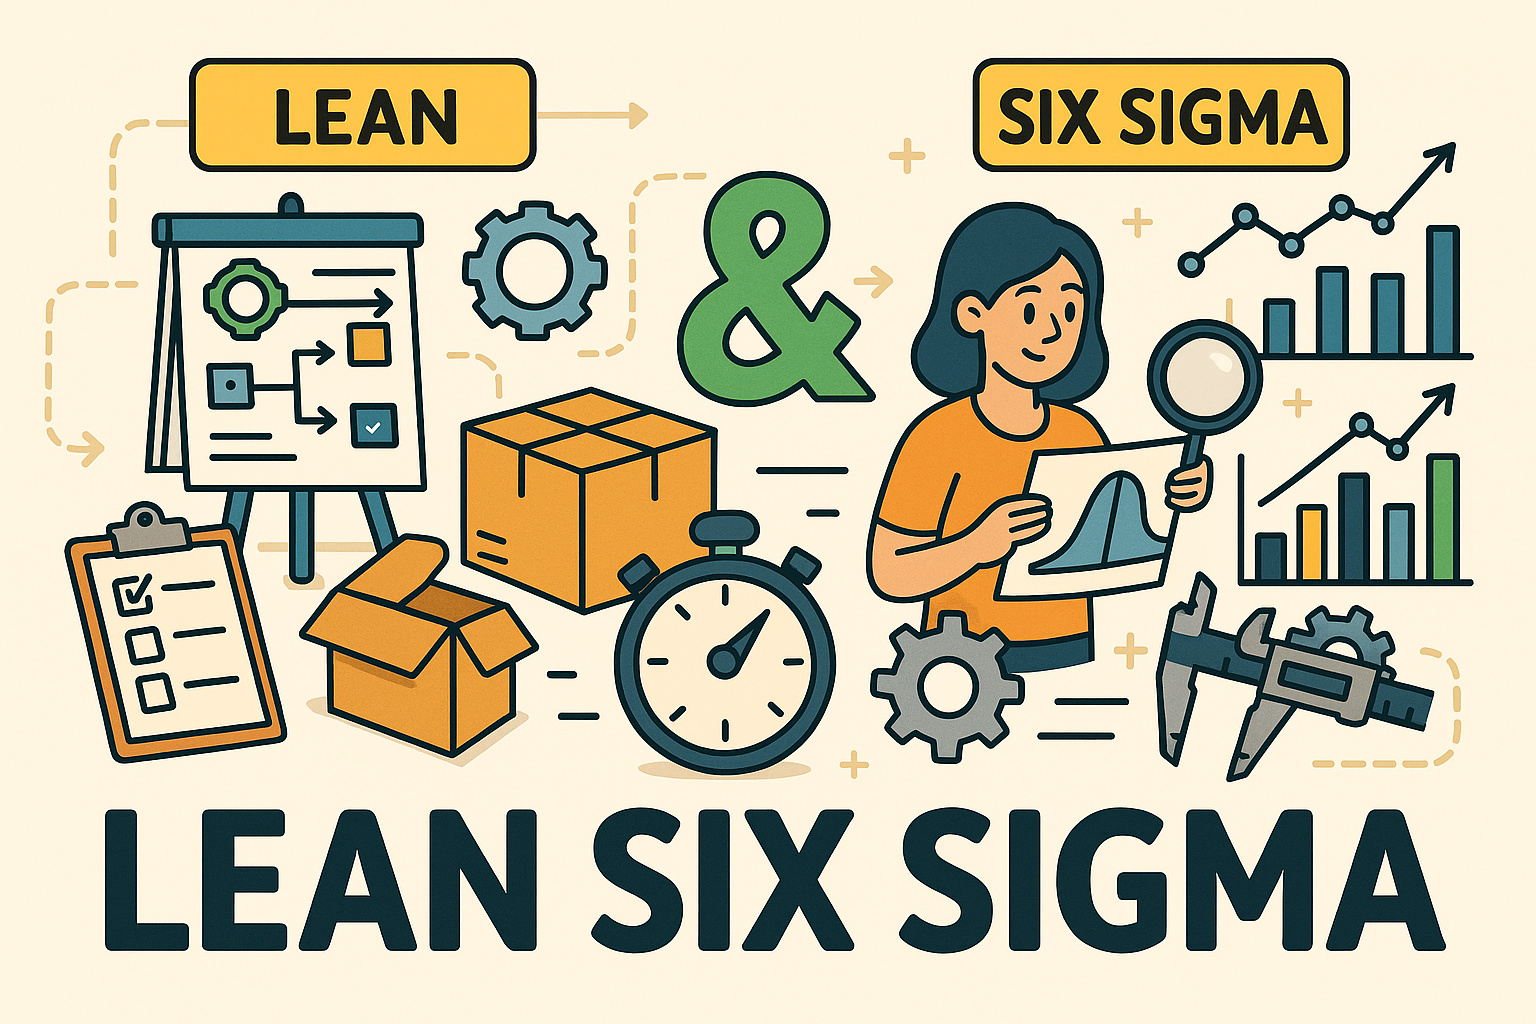
Lean Six Sigma
Lean Six Sigma is an integrated approach that combines Lean principles (focused on waste reduction and process flow) with Six Sigma methodology (focused on variation reduction and quality improvement). By bringing these two together, Lean Six Sigma aims to improve efficiency and effectiveness simultaneously, you get processes that are faster and produce fewer defects.
In practical terms, a Lean Six Sigma project will typically follow the Six Sigma DMAIC structure (Define, Measure, Analyze, Improve, Control) but will also incorporate many Lean tools in the Improve phase (and even in Analyze). For instance, the team might use value stream mapping (a Lean tool) to identify wasteful steps, then use statistical analysis (a Six Sigma tool) to pinpoint root causes of variation, then implement 5S or Kanban (Lean techniques) as part of the solutions, and finally put in a control chart (Six Sigma SPC tool) to sustain the gain.
Lean Six Sigma is used across industries to tackle a wide range of problems, from reducing patient wait times in hospitals (lean focus) to reducing error rates in lab results (six sigma focus). The strength of the combined approach is that Lean’s emphasis on simplicity and speed complements Six Sigma’s data-driven rigor.
For beginners, Lean Six Sigma provides a well-rounded toolkit: you learn to see and eliminate the nine wastes, and also to use data and statistical thinking to solve more complex problems. Organizations often train Lean Six Sigma belts (Yellow, Green, Black belts) who lead projects delivering measurable results in cost, quality, or time.
In essence, Lean Six Sigma should be used when processes need both streamlining and fine-tuning, it’s a holistic continuous improvement strategy blending two proven methodologies.
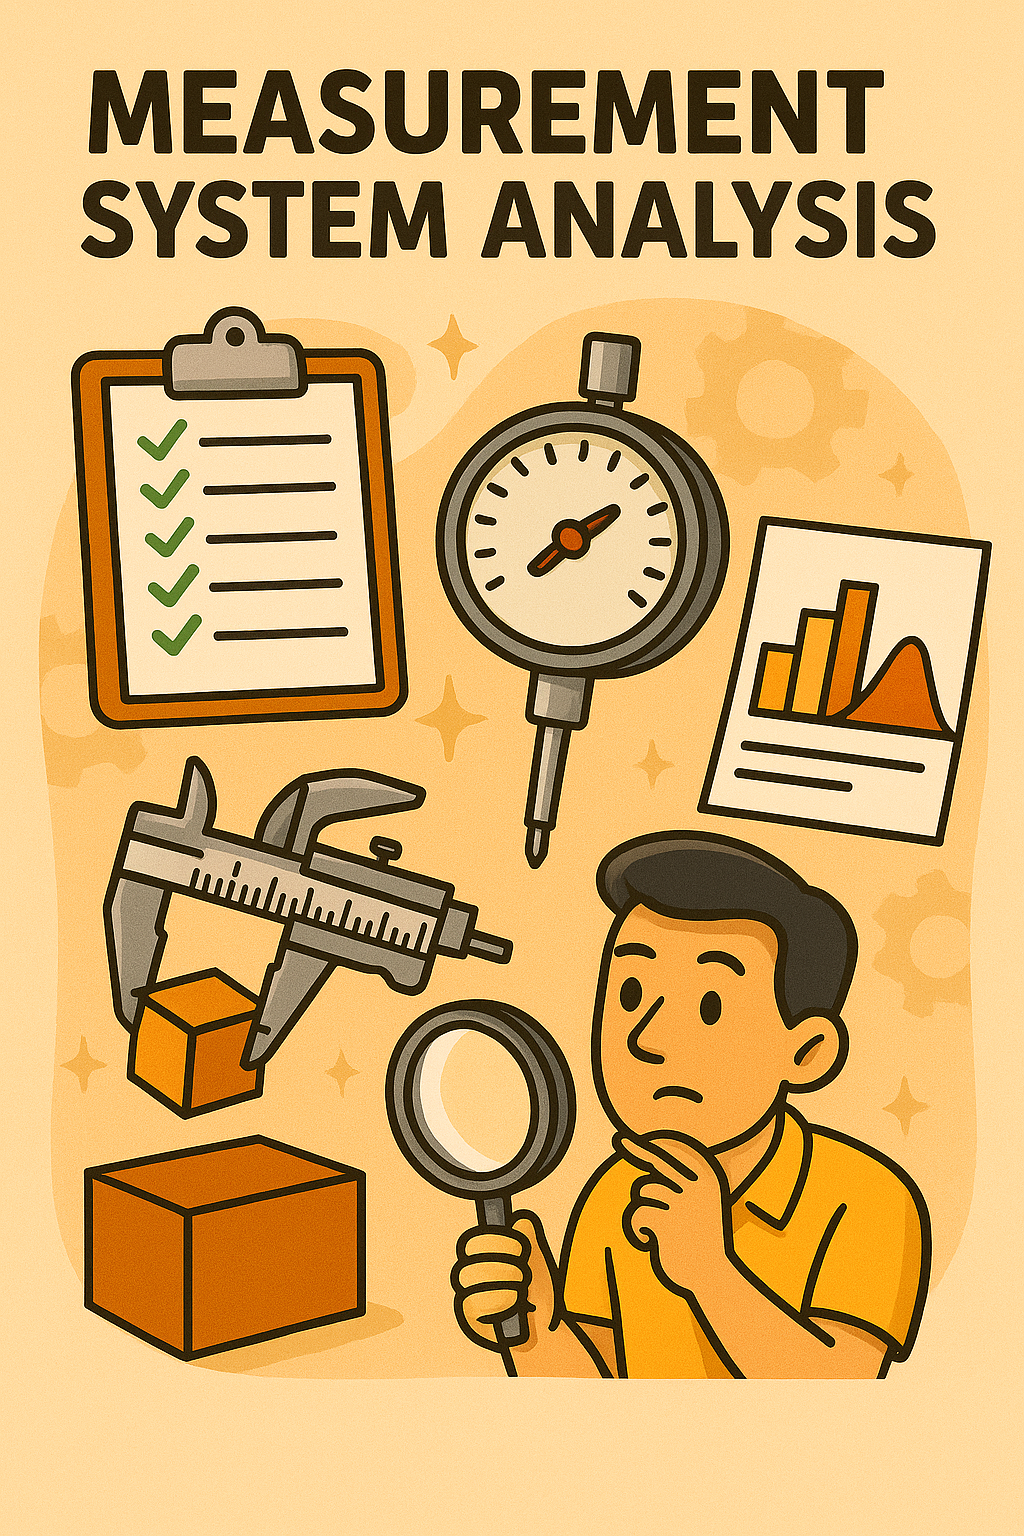
Measurement System Analysis (MSA)
Measurement System Analysis (MSA) is a procedure to evaluate the reliability of the measurements you collect, ensuring that your data is accurate and trustworthy for decision-making. It’s common to say “Garbage in, garbage out,” meaning if your measurement system is poor, your conclusions will be too.
MSA often focuses on R&R (repeatability and reproducibility) studies, which check how much of the observed variation in measurements comes from the measurement process itself. For example, imagine two operators measure the same part with a caliper multiple times. If one operator tends to record consistently higher values than the other, or if the same operator gets slightly different results each time, that measurement system has variation (noise).
An MSA quantifies this by having multiple appraisers measure multiple parts multiple times and then analyzing the data. The outcomes tell you things like: how much variability is due to the instrument (repeatability) and how much is due to differences between people (reproducibility).
If the measurement error is too high relative to the process tolerance or improvement goals, you’d need to improve the measurement system (e.g. better training, better instrument, clearer procedure) before trusting data from it.
MSA should be performed in the Measure phase of a Six Sigma project or whenever you’re relying on data and suspect that noise might be clouding the picture. In summary, MSA is about qualifying your rulers and scales, making sure that when you measure something, those numbers actually reflect reality well enough to drive improvement decisions.
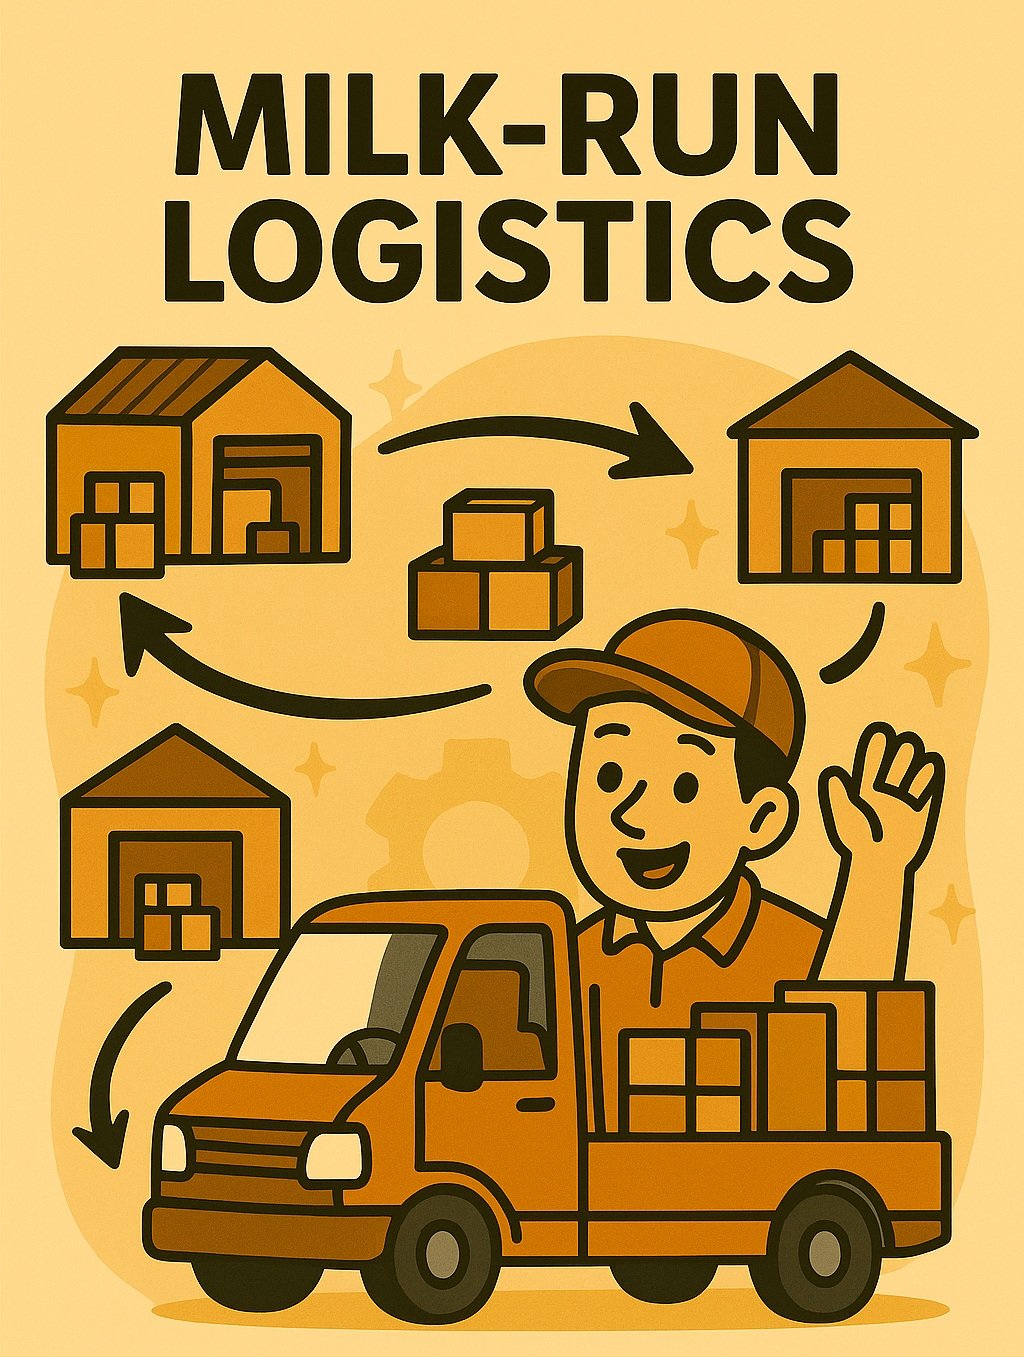
Milk-Run Logistics
A Milk-Run in logistics is a delivery method in which one vehicle makes rounds to multiple suppliers and/or customers in a single trip, similar to how a milkman in the old days would go door to door delivering milk and collecting empties.
Instead of each supplier sending separate trucks that might be half-empty, a milk-run coordinates pickups and drop-offs to maximize truck utilization and minimize total distance traveled. For instance, a single truck might leave a factory, deliver finished goods to Customer A, then Customer B, and on the way back swing by two suppliers to pick up needed raw materials, and return to the factory, all in one loop.
This approach is highly efficient because it consolidates shipments and reduces both transportation waste and inventory levels (materials arrive JIT, in smaller batches). Milk-runs are often used in Just-In-Time systems to ensure frequent, small deliveries of parts to a production line without the need for large on-site storage.
You should use a milk-run strategy when you have multiple sources or destinations in proximity and you want to optimize logistics. It requires planning and communication: schedules need to be fixed or signals like Kanbans need to be in place so the truck knows where to go and what to carry.
The result of a good milk-run system is lower transportation costs, less fuel usage (hence it’s environmentally friendly too), and a steadier flow of materials (reducing big inventory swings). In short, milk-run logistics is a lean way to manage deliveries and pickups: think of it as a circulatory system that keeps materials flowing regularly in the right amounts, rather than in big sporadic bursts.
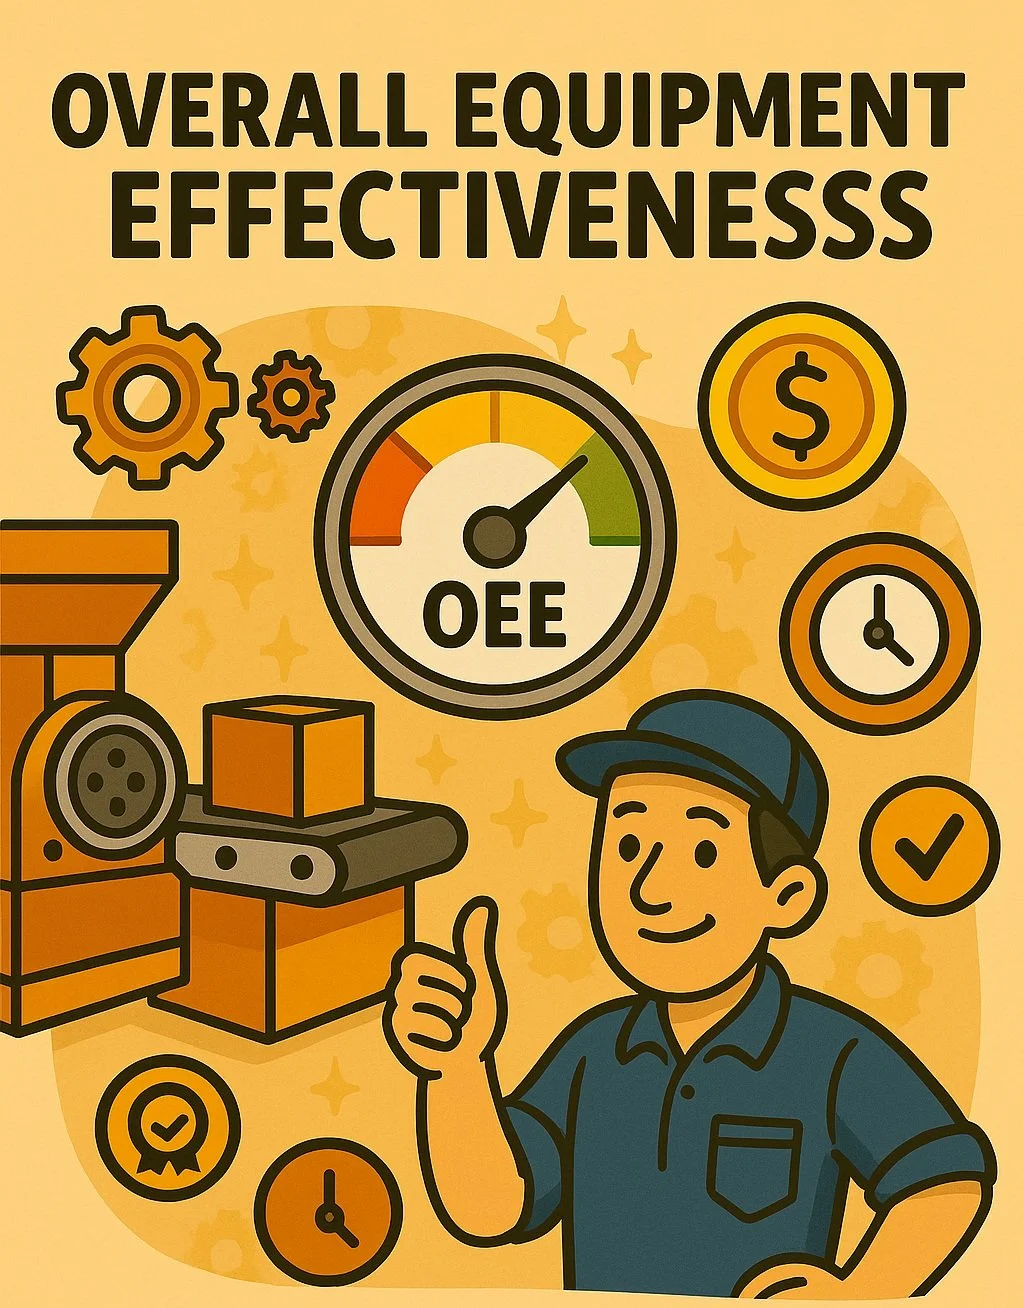
Overall Equipment Effectiveness (OEE)
Overall Equipment Effectiveness (OEE) is a metric that measures how well a manufacturing operation is utilized compared to its full potential, during the times it’s scheduled to run. It’s expressed as a percentage, and it combines three elements: Availability, Performance, and Quality.
Availability takes into account downtime losses (like equipment breakdowns or setup/changeover time), basically, what percentage of scheduled time the machine was actually running.
Performance looks at speed losses, was it running at the ideal speed or were there slowdowns/minor stops?
Quality accounts for output that did not meet quality standards (defects or rework).
OEE = Availability × Performance × Quality
For example, if a machine is available 90% of the time (10% downtime), and when running it goes at 95% of the ideal rate (5% slowdowns), and 98% of pieces are good (2% scrap), then OEE = 0.90 × 0.95 × 0.98 ≈ 83.7%.
World-class OEE is often quoted around 85-90% (which is very high in practice). OEE is used to identify where the biggest losses are, it points you to whether you need to focus on reducing breakdowns, improving cycle time, or addressing quality issues.
It should be used for critical equipment or production lines as a continuous improvement tracker. By breaking OEE into its components, teams can target improvements: for example, applying TPM to raise Availability, using SMED to cut setup time, or improving training to reduce defect rate. OEE is a useful overall health indicator for a process and helps prioritize kaizen efforts by showing what’s hurting productivity the most.

Obeya (Physical War Room)
Obeya (Japanese for “big room”) is a strategy and project management approach where a dedicated room is set up to house all information and visuals for a project, and often the project team itself, to enhance communication and collaboration.
Imagine a war room or command center, the walls are covered with charts: timelines, milestones, metrics, issue trackers, and design drawings, all updated in real time so the status of the project is clear at a glance. Project leaders and team members often sit in or near the Obeya, and they hold regular meetings there.
The Obeya concept was famously used by Toyota in product development; by locating the cross-functional team and all relevant information, decisions could be made quickly without waiting for formal reports. It breaks down silos because representatives from engineering, marketing, manufacturing, etc, are literally in the same space looking at the same information.
Obeya should be used for complex projects or strategic initiatives where fast coordination and problem-solving are needed. For example, when developing a new car model, an Obeya helps ensure that design, procurement, and production are synchronized. In Lean startups or any improvement initiative, you might also set up a form of Obeya to monitor progress on goals (some companies call this a mission control room).
The benefit is effective and timely communication, instead of endless emails or misalignment, everyone can “see” the current state and issues on the Obeya boards, which fosters quick, aligned actions. It’s a part of visual management at a higher (project/system) level. In summary, Obeya is about creating a shared space, physical or digital, where the collective brain of the team can focus on the project, leading to faster resolution of issues and a tighter team.
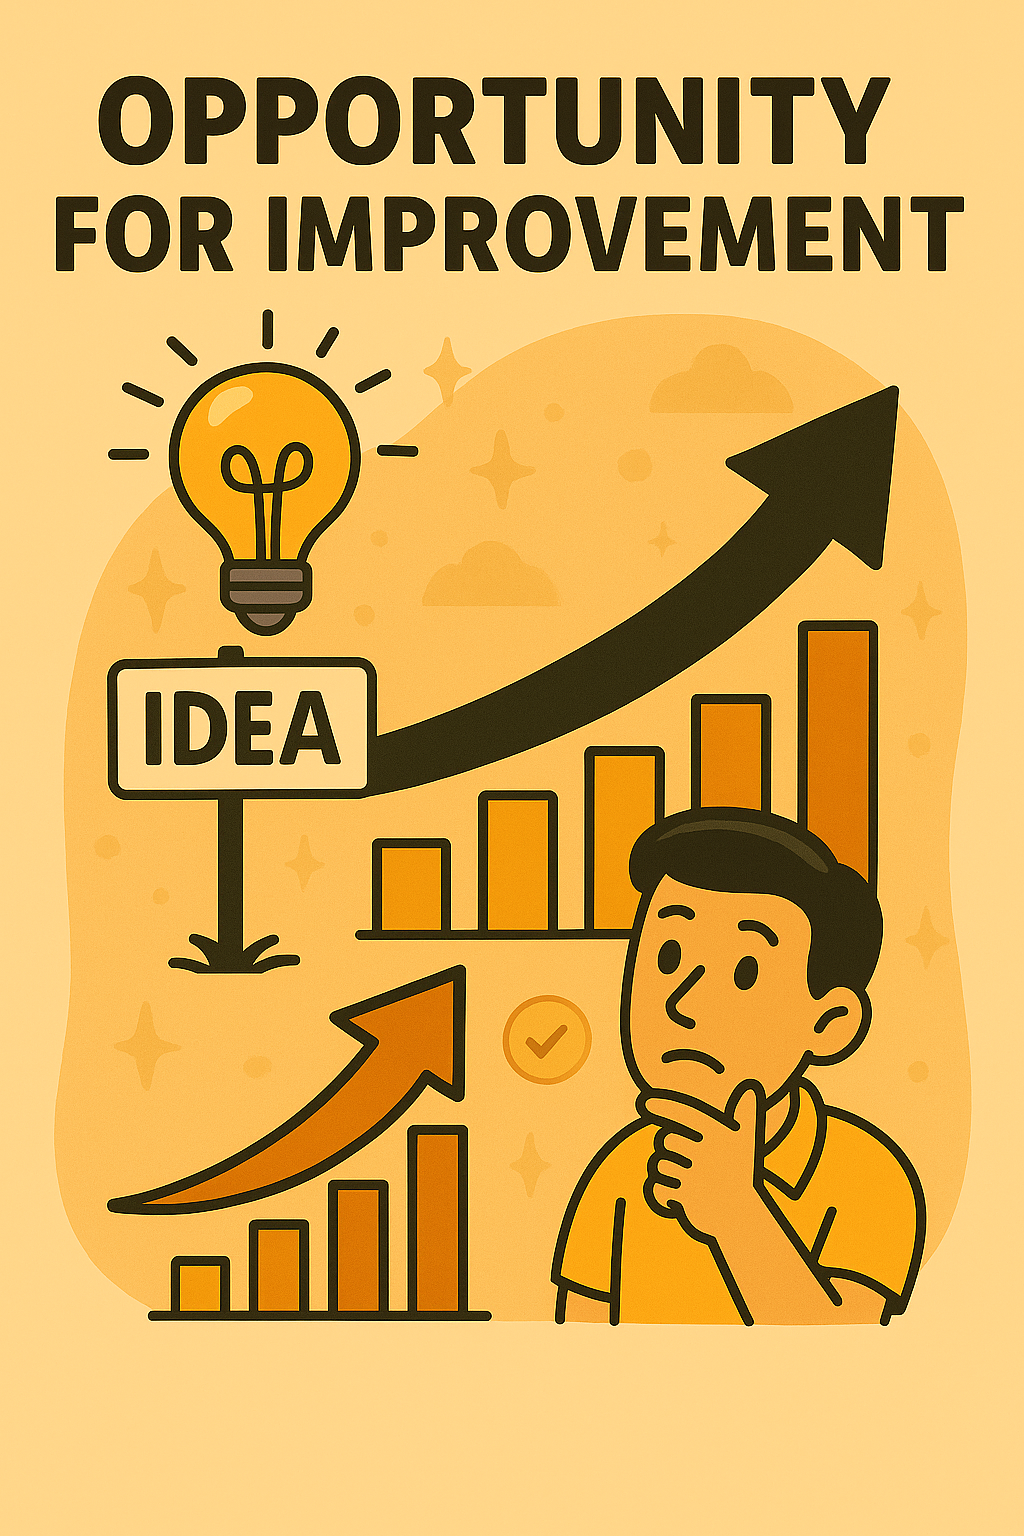
Opportunity for improvement (OFI)
Opportunity for Improvement (OFI) is a core concept in Lean thinking that refers to any gap between current performance and ideal or improved performance. It’s not necessarily a mistake or failure, but rather a chance to make things better, whether that means reducing waste, saving time, improving quality, or making work easier for someone.
In a Lean environment, opportunities for improvement are seen positively: they’re not about blame, they’re about learning. They often arise during Gemba walks, team meetings, Kaizen events, or when reviewing performance data. Examples might include noticing:
Workers spending time searching for tools (suggesting a 5S issue)
Bottlenecks in production flow (hinting at layout or process improvement)
Frequent rework (an indicator of quality problems)
Or even simply an idea from a team member to do something more efficiently
Organizations that embrace OFIs cultivate a continuous improvement culture where everyone from frontline operators to senior leaders are encouraged to spot issues and suggest better ways of doing things. Recognizing and acting on these opportunities is what drives Lean transformation forward.
Importantly, when an improvement is successfully implemented in one area, Lean organizations practice Yokoten, the systematic sharing and horizontal deployment of that learning across other teams, processes, or sites. Yokoten ensures that good ideas don’t stay isolated but are spread widely so the entire organization benefits. For example, if a team develops a more effective labeling system to prevent errors, yokoten means communicating that solution to other departments that handle similar materials.
This practice of capturing improvements and replicating them is essential to building organizational knowledge and accelerating improvement momentum. By combining the identification of OFIs with Yokoten, Lean companies don’t just solve problems, they create a culture where learning is multiplied and excellence becomes the norm.
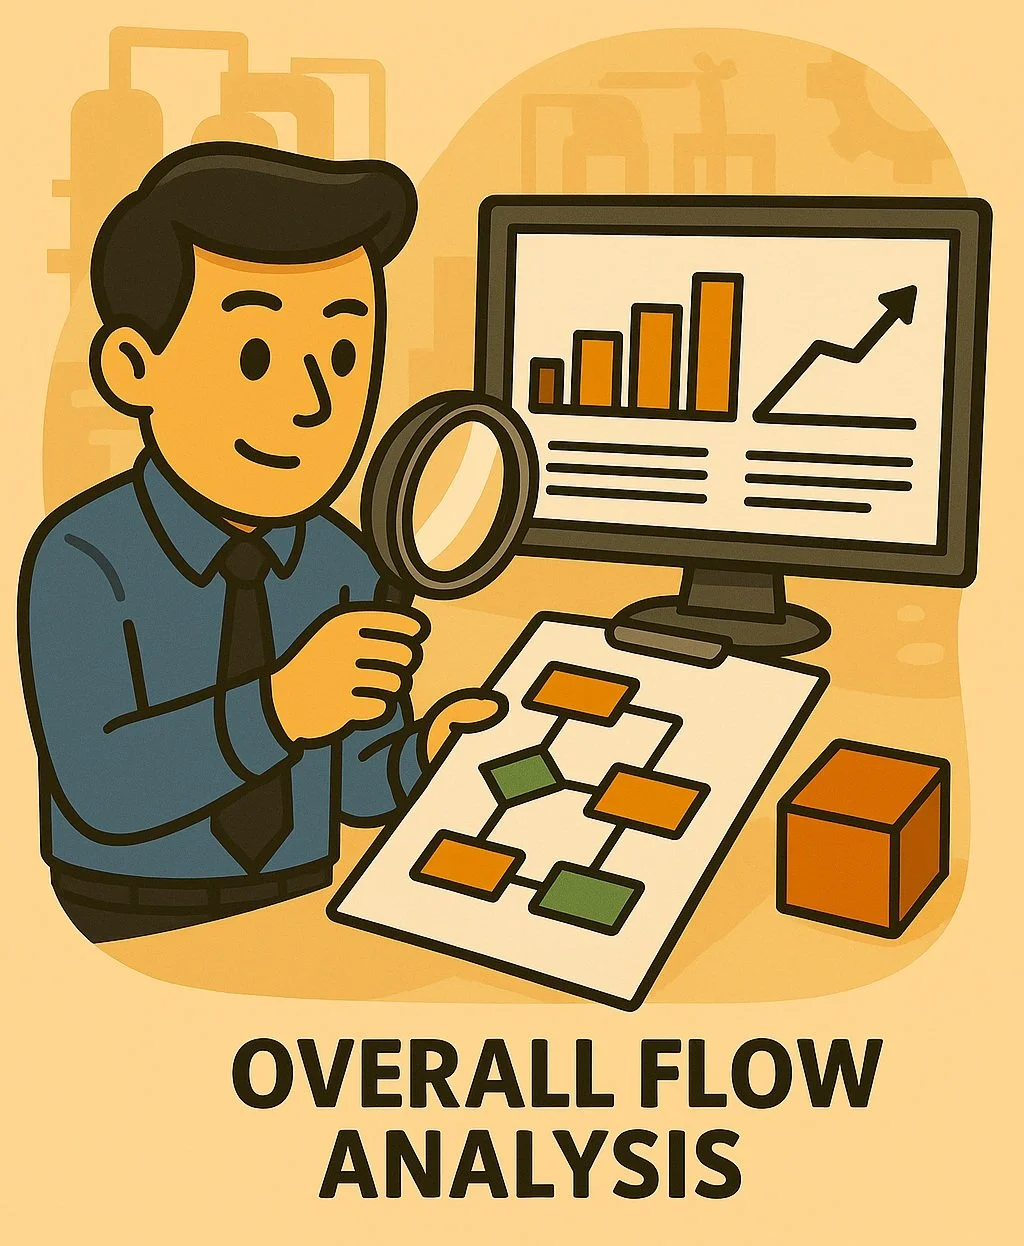
Overall Flow Analysis
Overall Flow Analysis is an examination of the entire sequence of steps in a process (or value stream) with an eye towards how smoothly work flows from start to finish. It involves looking at the big picture of how work moves, where it speeds up, where it bottlenecks, where it stops and waits.
The goal is to identify any hindrances to continuous flow. To perform an overall flow analysis, one might do a Value Stream Map of the process, noting each step, the time it takes, and the wait times or inventory between steps. For instance, consider an order fulfillment process: overall flow analysis would chart the journey from order receipt to product shipment, measuring how long each stage takes (order processing, picking, packing, shipping) and where orders might queue up.
If you find that orders sit in a queue waiting for credit approval for 2 days, that is a flow issue to address. This analysis should highlight the critical path and the constraint or slowest point of the process. It’s somewhat analogous to a doctor checking the health of your entire circulatory system, not just one organ.
Use overall flow analysis when you suspect that the handoffs or the sequencing of operations is causing delays, it helps you see beyond individual tasks and understand the coordination of the whole. It’s especially useful before local optimizations; you want to improve the overall flow, not just sub-optimize parts. The output of this analysis is often identification of opportunities like: combining steps, eliminating approvals, balancing workloads, or implementing pull systems to control flow.
Essentially, overall flow analysis asks, “From the time we start work on a product/service to the time it’s completed, what happens and how can it flow better?” and it sets the stage for Lean improvements across the entire process rather than just isolated points.
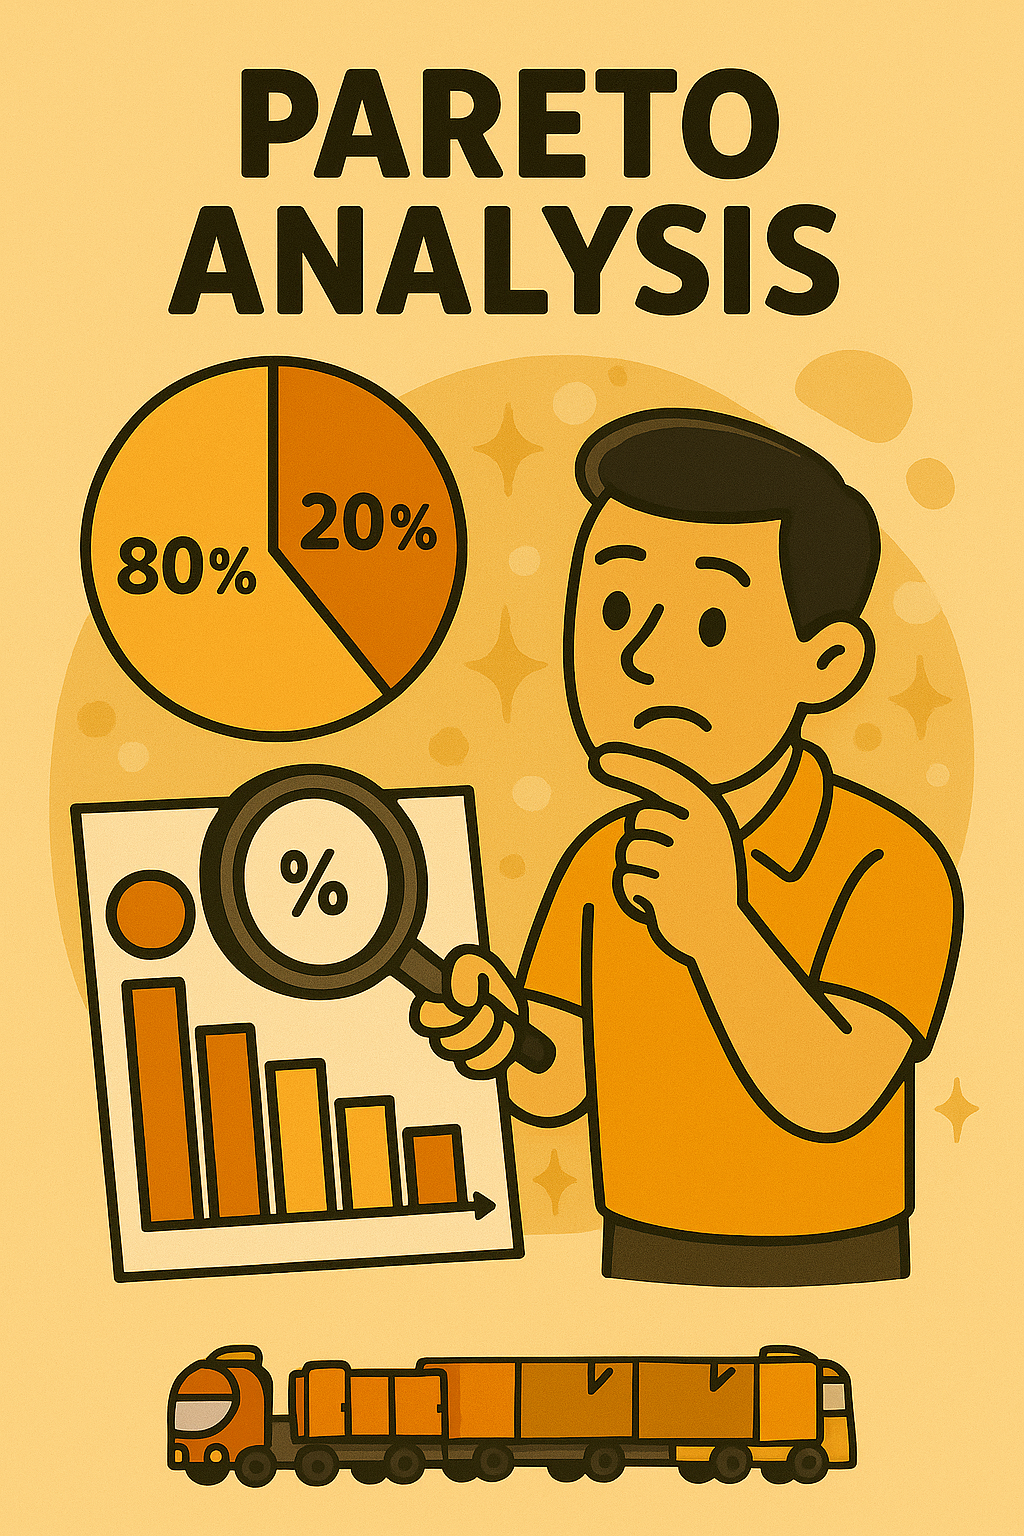
Pareto Analysis
Pareto Analysis is a technique for prioritizing causes or problems to focus on, based on the idea that a small number of causes typically account for the majority of the effect. It’s rooted in the 80/20 rule, for example, 20% of defect types might cause 80% of the defects, or a few customers account for most complaints.
In practice, Pareto Analysis involves collecting data on the frequency or impact of different issues, sorting them in descending order, and often presenting them in a Pareto chart (a bar graph where bars are ordered from largest to smallest, with a cumulative percentage line). This visual makes it clear which “vital few” categories are the biggest contributors and which are the “trivial many”.
By focusing on the vital few, you get the most significant improvement with the least effort. For example, if you have a dozen types of errors in a process, and Pareto analysis shows that two types make up 60% of all errors, you’d tackle those first for the biggest gain. Pareto Analysis should be used in the Analyze phase of problem solving, when identifying root causes, or in any situation of resource allocation.
It’s a way to avoid getting overwhelmed with issues and instead target your Lean efforts where they matter most. Beginners can do this easily by tallying issues (like reasons for downtime in a machine) and then making a simple bar chart. The insight you often get is a clear priority list. In short: not all problems are equal, and Pareto Analysis helps you separate the few big ones from the many small ones.
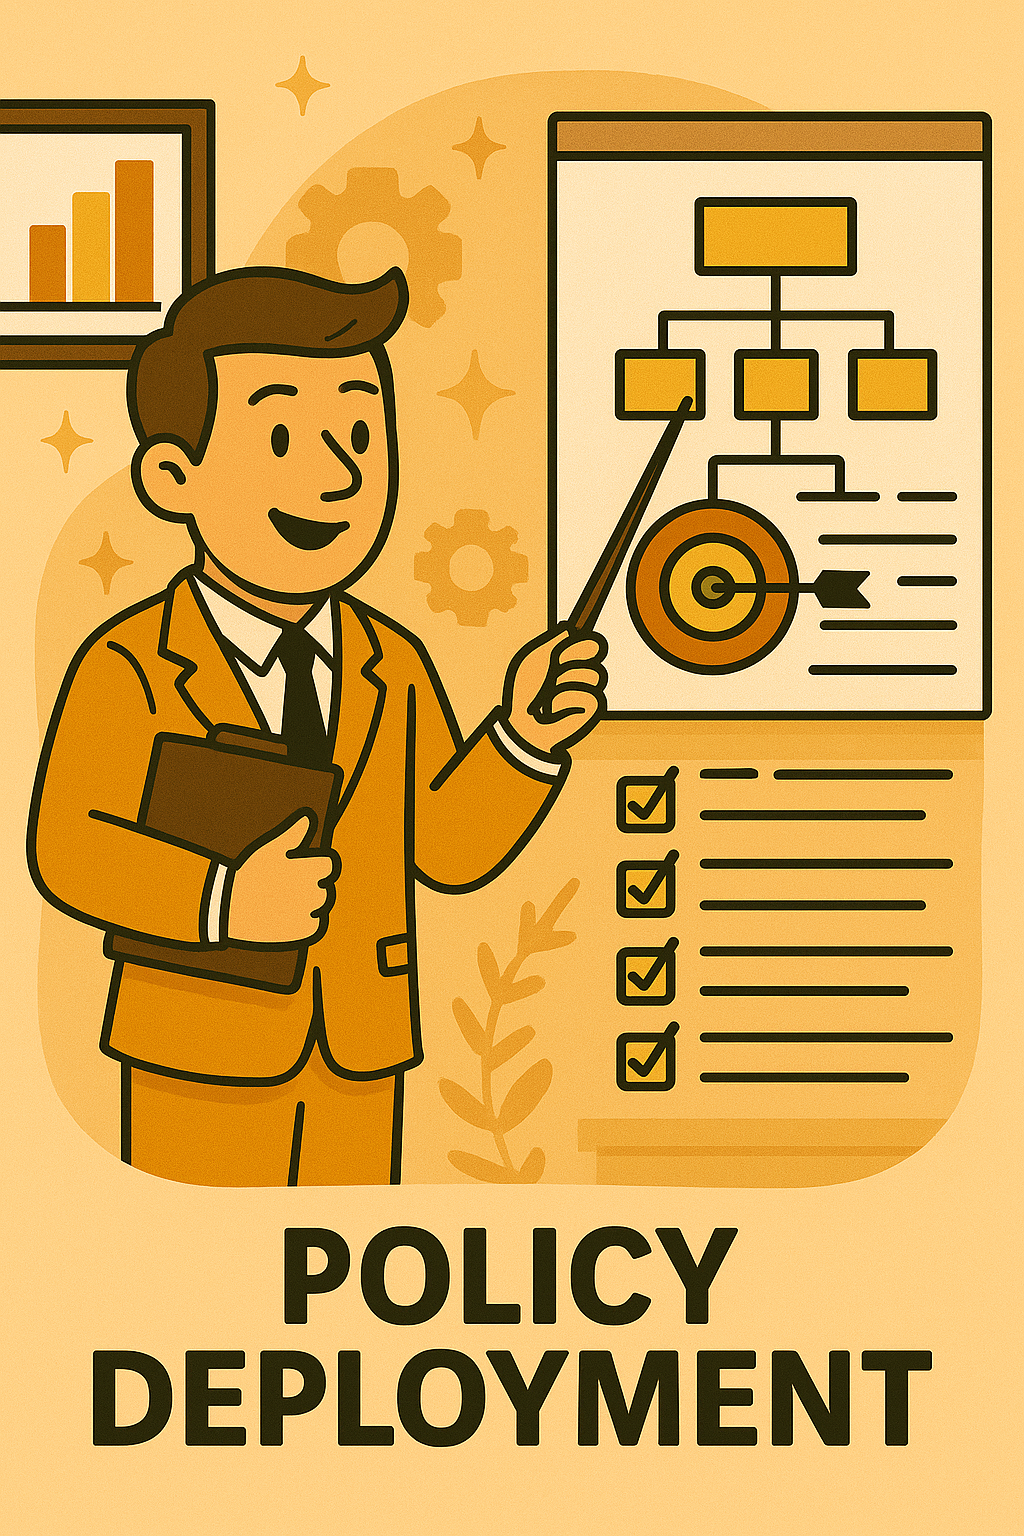
Policy Deployment
Policy Deployment is another term for Hoshin Kanri, the process of translating high-level strategy into actionable plans throughout the organization. It ensures that the big goals or policies set by leadership are carried out via specific projects and targets at each level.
Essentially, policy deployment is the mechanism for focus and alignment: rather than each department chasing its own local goals, everyone’s objectives are derived from and contribute to the company’s key objectives. For example, if the company’s policy is to become number one in customer satisfaction, policy deployment might result in a customer-response-time improvement goal for the support department, a defect reduction goal for manufacturing, and a user-friendliness design goal for R&D, each with metrics and initiatives attached.
The “catchball” process in policy deployment (the back-and-forth negotiation of goals) ensures achievability and buy-in. Policy Deployment should be used during strategic planning cycles, typically annually, and revisited quarterly or monthly to check progress. It prevents the waste of misalignment, where one team’s improvements might inadvertently hurt another’s performance or not contribute to broader goals.
When done well, it creates a “line of sight” for every employee: I can see how my daily work and improvement ideas tie into the company’s mission and targets. So if you hear “policy deployment” in Lean, think “structured goal cascade” it’s how you deploy the strategy into the hands of those executing, ensuring everyone is moving in the same purposeful direction.
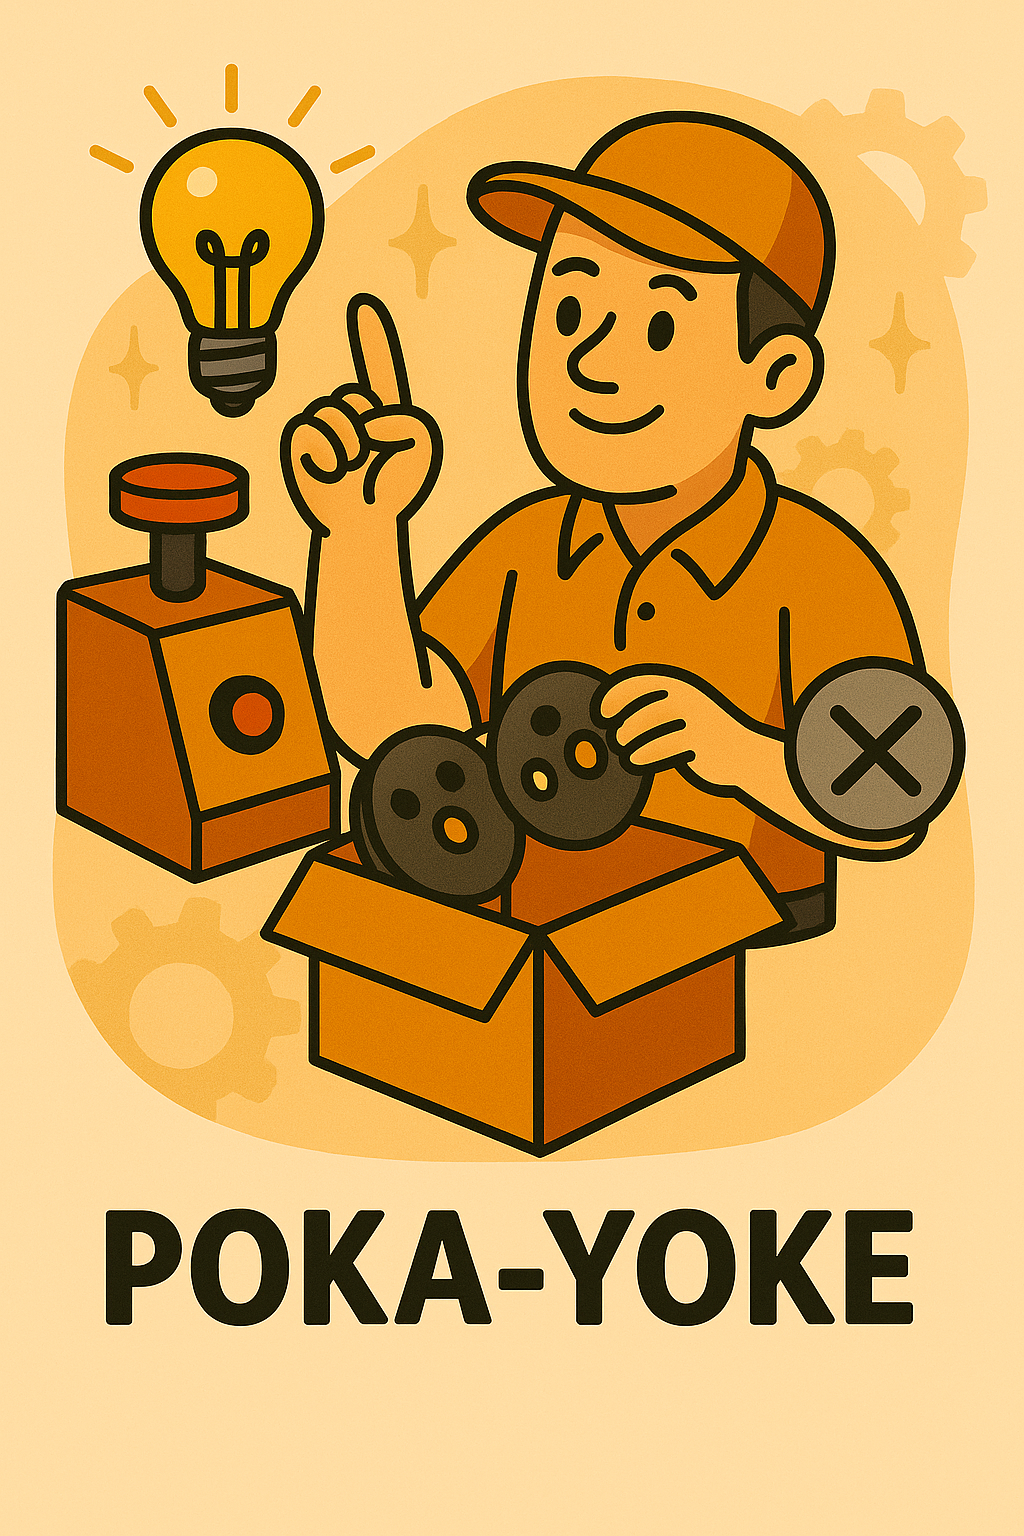
Poka‑Yoke
Poka-Yoke means “mistake-proofing” in Japanese. It’s a technique for preventing errors by designing the process, equipment, or tools such that it’s either impossible or very difficult to do something wrong, or at least immediately evident if a mistake has happened.
The idea is to eliminate defects by addressing the root cause, human error or inadvertent mistakes, through simple, often physical, devices or process changes.
Examples of poka-yoke are everywhere: think of a USB stick that can only be plugged in one way, or an assembly jig that only fits if the part is oriented correctly. In offices, a digital form might gray out fields that aren’t applicable based on a prior answer, preventing an invalid combination of inputs. Another everyday example: microwave ovens won’t start if the door is open (a safety poka-yoke).
You should use Poka-Yoke whenever an error recurs or even could occur, especially at points where inspection is costly or unreliable. Instead of relying on people to catch mistakes, change the process so the mistake can’t happen or signals itself immediately. In Lean, this is far more effective because it’s proactive quality control.
For beginners, a good approach is to walk through a process and ask: “What could go wrong here?” and then think of low-cost interventions. For instance, in a packaging station, if sometimes the wrong label gets applied, a poka-yoke could be as simple as unique label holders that only accept the correct label roll for each product.
Poka-yokes are often simple and creative, and operators often have great ideas for them. Ultimately, it’s about zero defects mindset: using poka-yoke means you’re designing out the opportunity for error at the source, ensuring quality without needing 100% vigilant inspection.
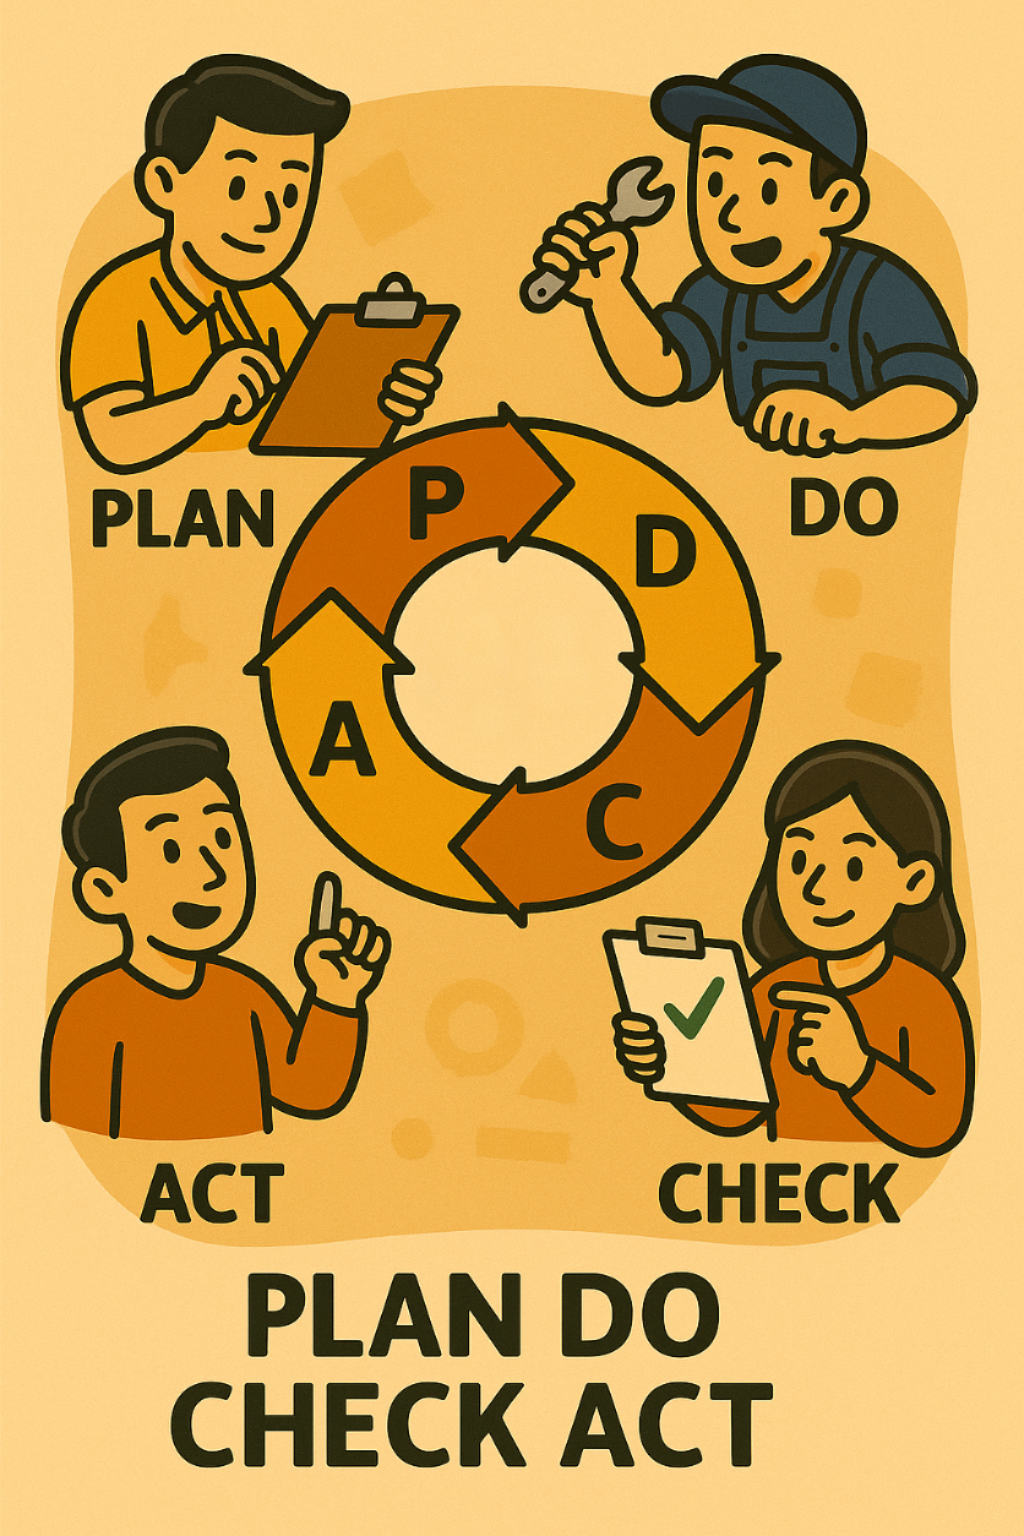
Plan‑Do‑Check‑Act (PDCA)
PDCA (Plan-Do-Check-Act), sometimes called PDSA (Plan-Do-Study-Act), is a four-step iterative method for continuous improvement of processes, products, or solving problems. It’s like a scientific method in mini form.
Plan - you identify an opportunity or problem, form a hypothesis about an improvement, and plan the change.
Do - you implement the change on a small scale.
Check or Study - you analyze the results of the test, compare them against the expectations, and gain insights, did the change work, and if not, what happened?
Act - you standardize the successful change (make it the new normal if it solved the problem), or decide on next steps, which could mean going through another PDCA cycle refining the idea or trying something different if the test didn’t meet expectations.
PDCA is the core of the Kaizen mindset: continuous, small cycles of improvement. You should use PDCA whenever facing a problem or uncertainty about the best way forward.
For example, if a machine has frequent minor stops, a team might:
Plan a hypothesis - maybe lubrication is an issue and plan to try a new schedule.
Do - for a week.
Check - the downtime data (improved or not?).
Act - by adopting the new schedule if it helped or trying a different approach if not.
In Lean daily management, teams are doing many PDCA cycles on various issues all the time. It’s important to keep the cycles short and learning-oriented, even if a change fails, the check part yields knowledge that informs the next cycle and educates the staff.
The strength lies in its simplicity and action-oriented nature. Rather than getting stuck in endless analysis, PDCA encourages you to make a practical plan, test it, observe the results, and adjust accordingly. The goal is not perfection in one leap but steady learning through iterative cycles. Even if a change doesn’t work, the insights gained during the "Check" phase fuel smarter actions in the next round.
In essence, PDCA is a disciplined yet flexible habit that empowers teams to keep improving, every day.
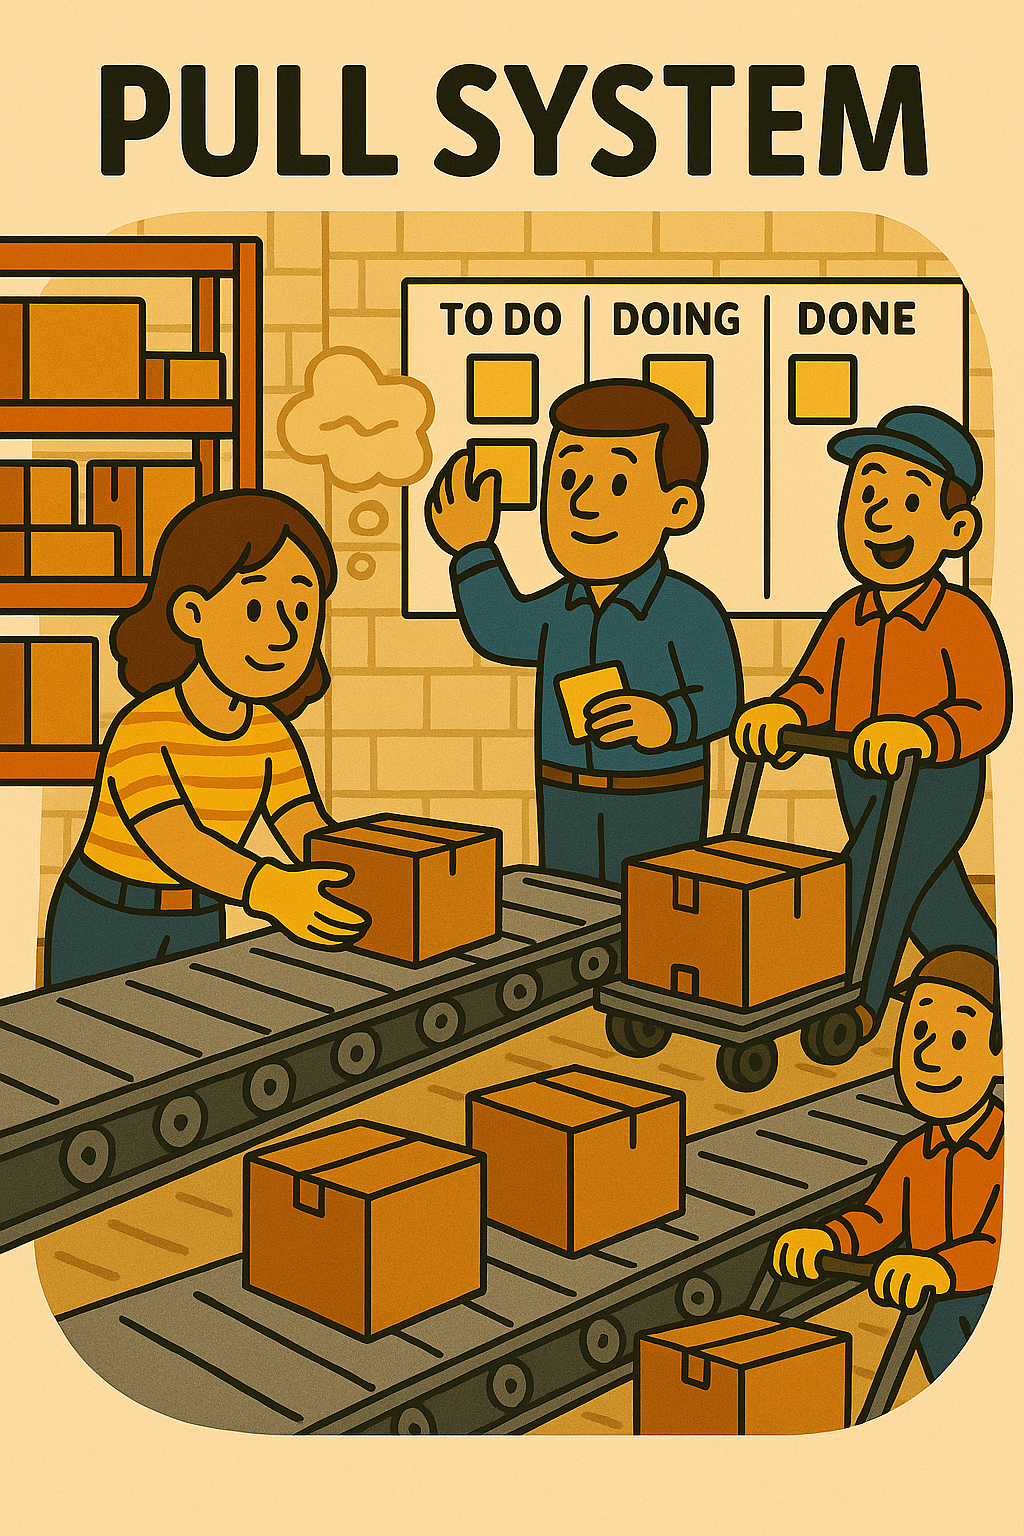
Pull System
A Pull System is a method of controlling workflow and production by only initiating work based on actual demand from the next process or customer, rather than pushing work based on forecasts or schedules. A Pull System is about producing only in response to demand, which in Lean terms is a key to achieving Just-In-Time and avoiding the waste of overproduction.
In a pull system, each stage only “pulls” what it needs from the previous stage when it needs it, often using signals like Kanban cards as triggers. This contrasts with a “push” system, where work is scheduled centrally and sent downstream irrespective of whether the downstream is ready for it. The effect of pull is that it automatically limits inventory and overproduction: if the next process is not asking for more, the previous process won’t make more.
A simple example is a supermarket shelf, products are replenished (pulled) when customers buy them, not before. In manufacturing, you might have a kanban square on the floor; only when it’s empty does the upstream process build another unit to place there. Pull systems should be used wherever continuous flow is not possible and you need a way to regulate production between decoupled steps.
It’s particularly useful in mixed-model production and supply chain management. Implementing a pull system requires some conditions: processes need to be relatively reliable and predictable in their cycle times, and you need to determine appropriate buffer sizes (like how many Kanban cards in circulation) to account for normal variations.
The benefits are significant: pull keeps the system lean by preventing build-up of excess WIP and finished goods, it shortens lead times, and often improves quality (since work isn’t sitting around deteriorating or getting outdated).
When starting, a good step is to convert areas that currently work on push (schedule-driven) to pull by introducing signals, for example, a printed Kanban card or an electronic signal, that downstream needs something. In summary, a Pull System is about producing only in response to demand.
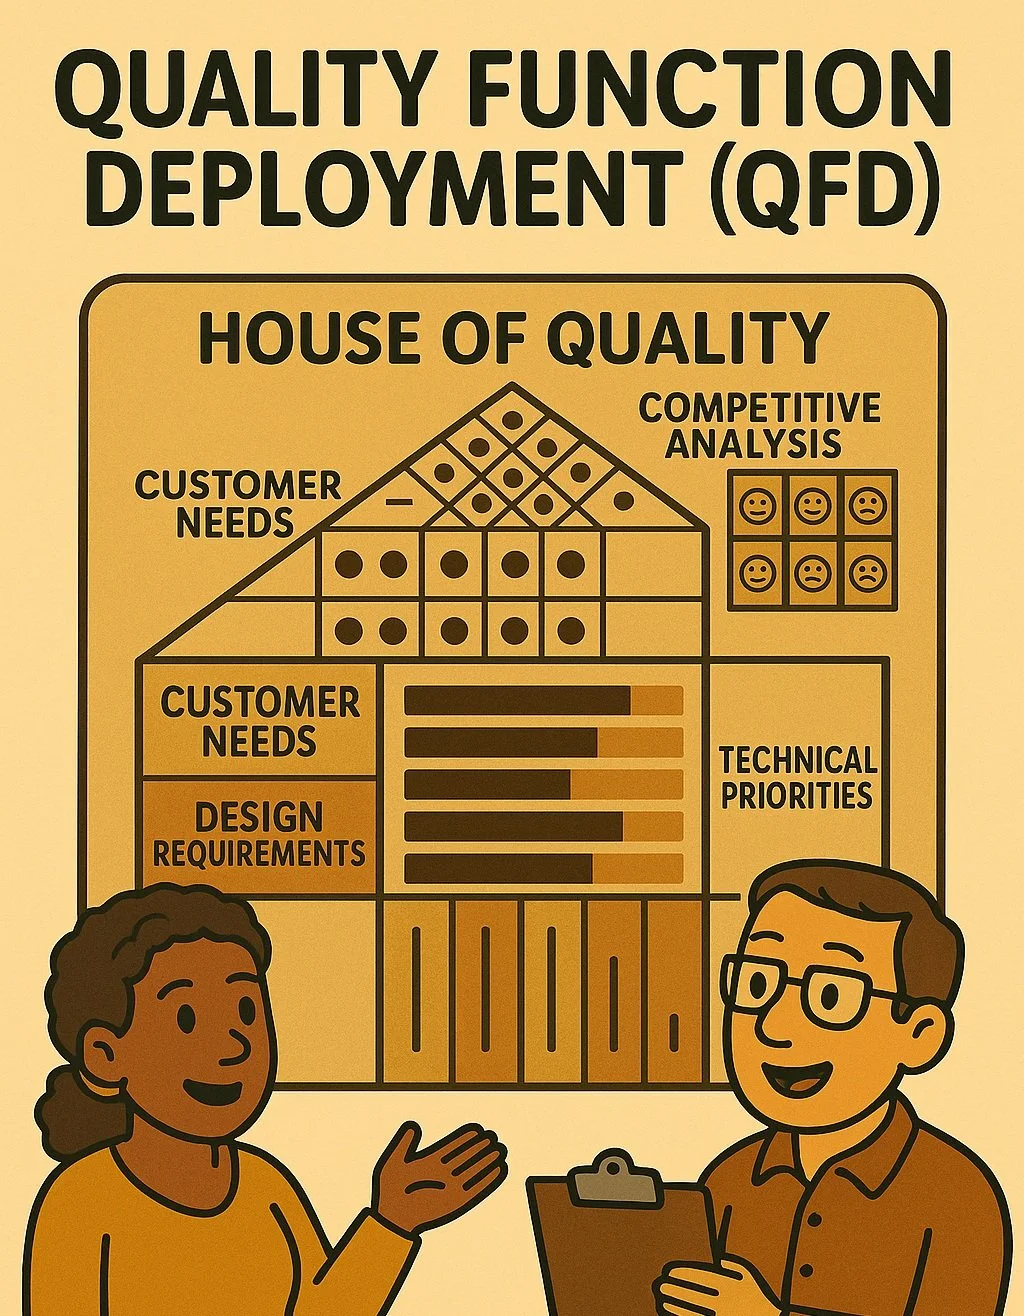
Quality Function Deployment (QFD) / House of Quality
Quality Function Deployment (QFD) is a structured approach for translating customer requirements (the “Voice of the Customer”) into specific, measurable design or process specifications and priorities. It often uses a set of matrices; the first and most famous matrix is called the House of Quality because of its house-like shape.
In the House of Quality, the rows list customer wants and the columns list design attributes or features. Through a systematic scoring process, the team evaluates how well each design feature satisfies each customer want, and also how the design features relate to each other.
The result is that you can see which features are most important to focus on to deliver what the customer values, and you ensure you’re not missing any key customer needs. QFD isn’t just one matrix; it can be a series (cascading into parts deployment, process planning, production planning), but beginners typically focus on the first house.
You should use QFD early in product development or when designing a service, essentially at the concept stage, to make sure you build the right thing. It’s very useful when customer needs are complex or not well understood by the engineering team because it forces discussions in a cross-functional team (marketing, design, manufacturing, etc.) about what the customer really means and how to achieve it.
QFD helps prevent the scenario where you develop something that technically works but doesn’t satisfy the client. By deploying quality from customer down to processes, you align all efforts with creating value as defined by the customer.
For example, if customers of a car care about “easy to park,” QFD might drive a requirement for a certain turning radius or camera system in design specs. The House of Quality makes trade-offs visible too (maybe “easy to park” vs “spacious interior” has a conflict) so teams can innovate to reconcile them. In a nutshell, QFD/House of Quality is a guide for designing with the customer in mind, ensuring the voice of the customer echoes through the engineering and operations decisions.
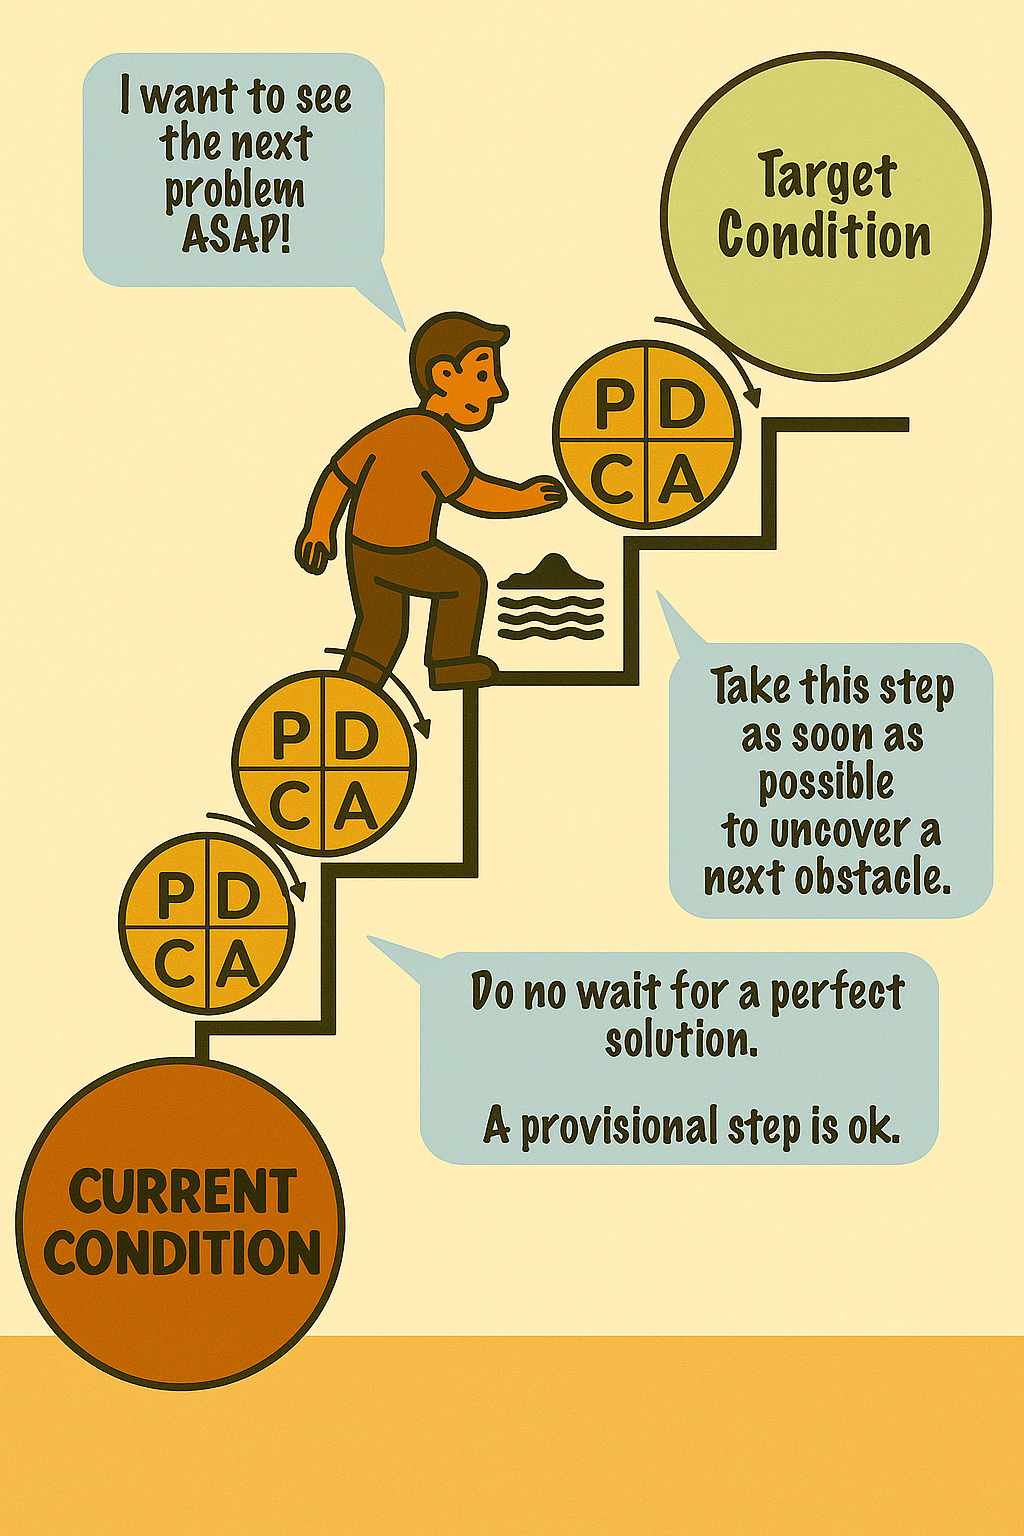
Rapid PDCA
Rapid PDCA refers to executing the Plan-Do-Check-Act cycle quickly and repeatedly in order to speed up learning and improvement. It’s essentially a miniaturized PDCA that might happen over hours or even minutes, rather than days or weeks.
This concept was observed in how Toyota works, they strive to turn the PDCA wheel very fast, sometimes making a small change and checking results in the same shift, multiple times. The reason to do rapid PDCA is to not wait for the “perfect” solution or over-analyze, but rather try something small now, learn immediately, and iterate.
For example, if an assembly process is struggling with a new part, a rapid PDCA approach might be:
Plan – hypothesize adding a temporary fixture might help;
Do – rig one up quickly and try it on the next few units;
Check – see if errors decreased in the last hour;
Act – if it works, refine it and continue, if not, adjust the idea and run another quick trial.
By doing this, the team might cycle through several tweaks in a day, whereas a slower approach might schedule a formal trial next week. You should use rapid PDCA when conditions allow quick testing and when the cost of a trial is low - e.g. on a pilot line, in software deployments with fast feedback, or any scenario where you can simulate or try changes without a huge downside.
It’s very powerful in Kata or continuous improvement culture: treat each action like an experiment to be immediately learned from. One key to rapid PDCA is having good real-time metrics (so you can Check quickly) and a willingness to make small reversible changes. The benefit is you accelerate the learning curve rather than deliberating a long time, you learn by doing, and often you’ll discover things that analysis alone wouldn’t reveal.
Essentially, rapid PDCA compresses the wheel to spin faster, which means problems are solved faster or adjustments made more nimbly, keeping the team adaptive.
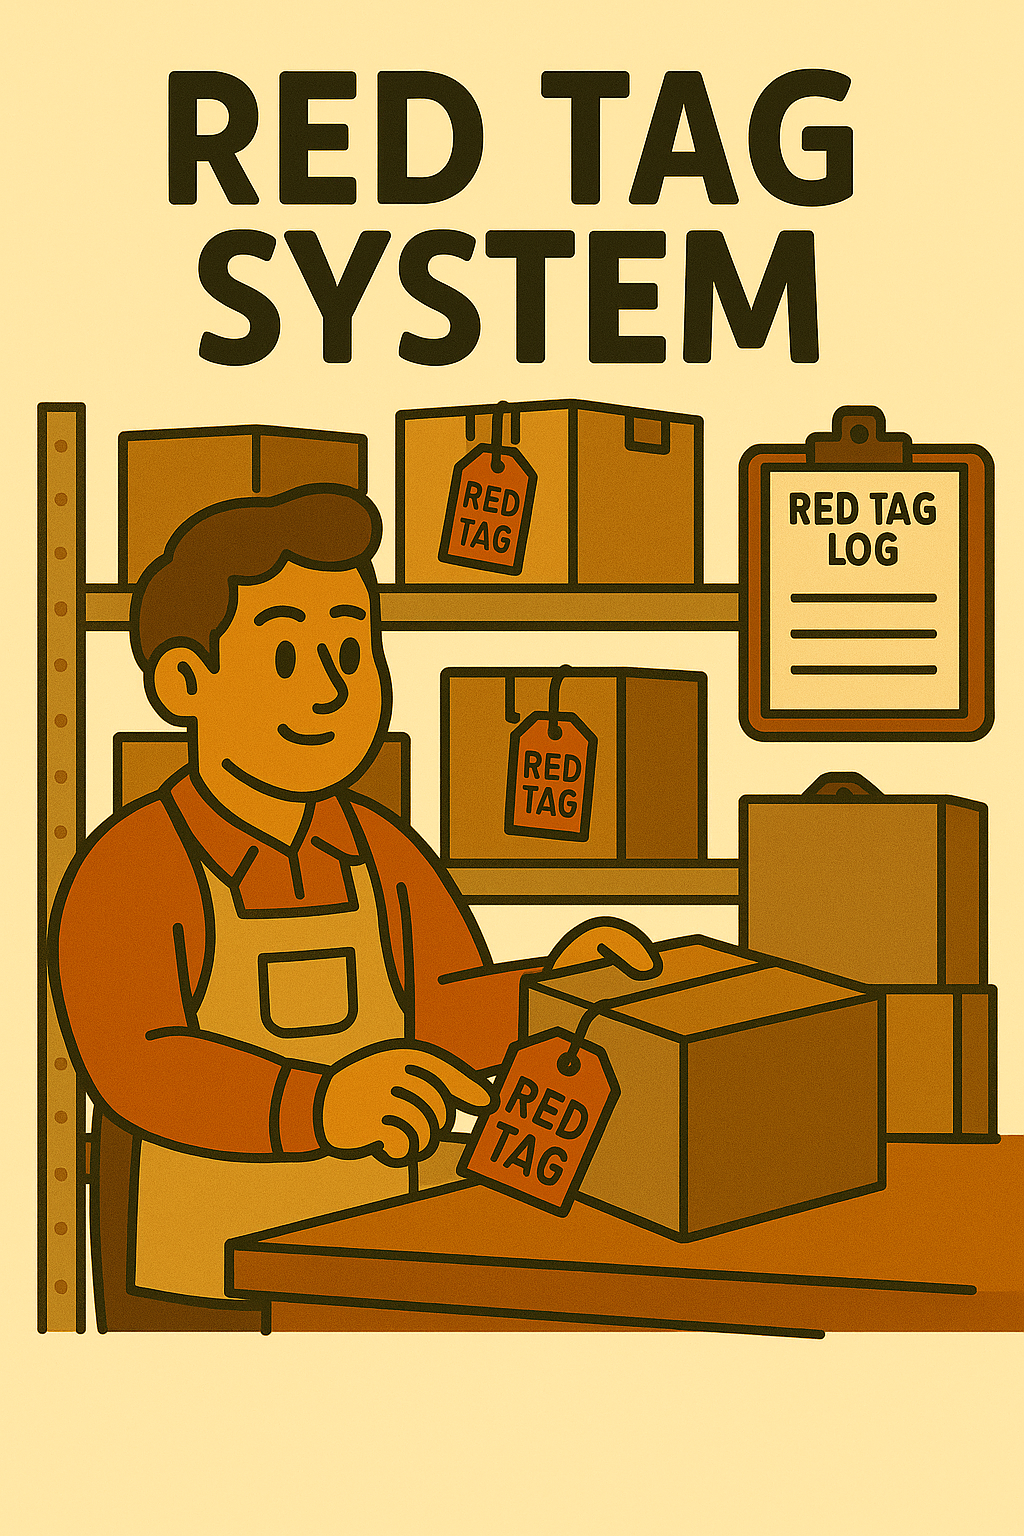
Red Tag System
A Red Tag System is a method used during the Sort phase of 5S to identify items that are not needed in the work area and deal with them appropriately. When you do a 5S Sort, you and your team go through everything in the workspace and attach a red tag (a physical red label or sticker) to any item whose necessity is in question or that you’re sure is not needed for current operations.
Each red tag usually has fields to write information:
Item Description:
What is this item? Be specific—e.g. “Large metal bracket,” “Box of old manuals.”Part Number:
If known a part could be found in wrong areas.Department/Area:
Where was it found? Which workstation or location?Reason for Tagging:
E.g. “No longer used,” “Unknown purpose,” “Damaged,” “Obsolete.”Date Tagged:
When the item was tagged.Tagged By:
Name of the person tagging it.Disposition Deadline:
Date by which a final decision must be made.Disposition Action: (To be filled in later)
Check one:
☐ Reuse / Return to Area
☐ Relocate
☐ Recycle / Scrap
☐ Dispose
The red tag area is like “limbo” for stuff if an item sits there beyond a set deadline (say, 1 month) without anyone claiming a need for it, then you dispose of it (throw away, recycle, sell, or relocate it out of the area). If someone does need it, it finds a new appropriate home.
The Red Tag system should be used whenever you’re doing a cleanout of a cluttered space; it brings discipline and visibility to the process of deciding what stays and what goes. It prevents the common problem of people being afraid to remove things (“maybe we’ll need it someday”) by giving them a safety net: the item isn’t gone immediately, it’s just set aside pending final decision.
In effect, red tagging eliminates the waste of excess inventory, tools, and equipment lying around that serve no purpose. After implementing a red tag system, workplaces reclaim space and improve organization significantly, because only the necessary items remain at the point of use. For beginners, it’s a very tangible and satisfying introduction to Lean you physically see the workplace getting leaner, and it’s usually a quick win.
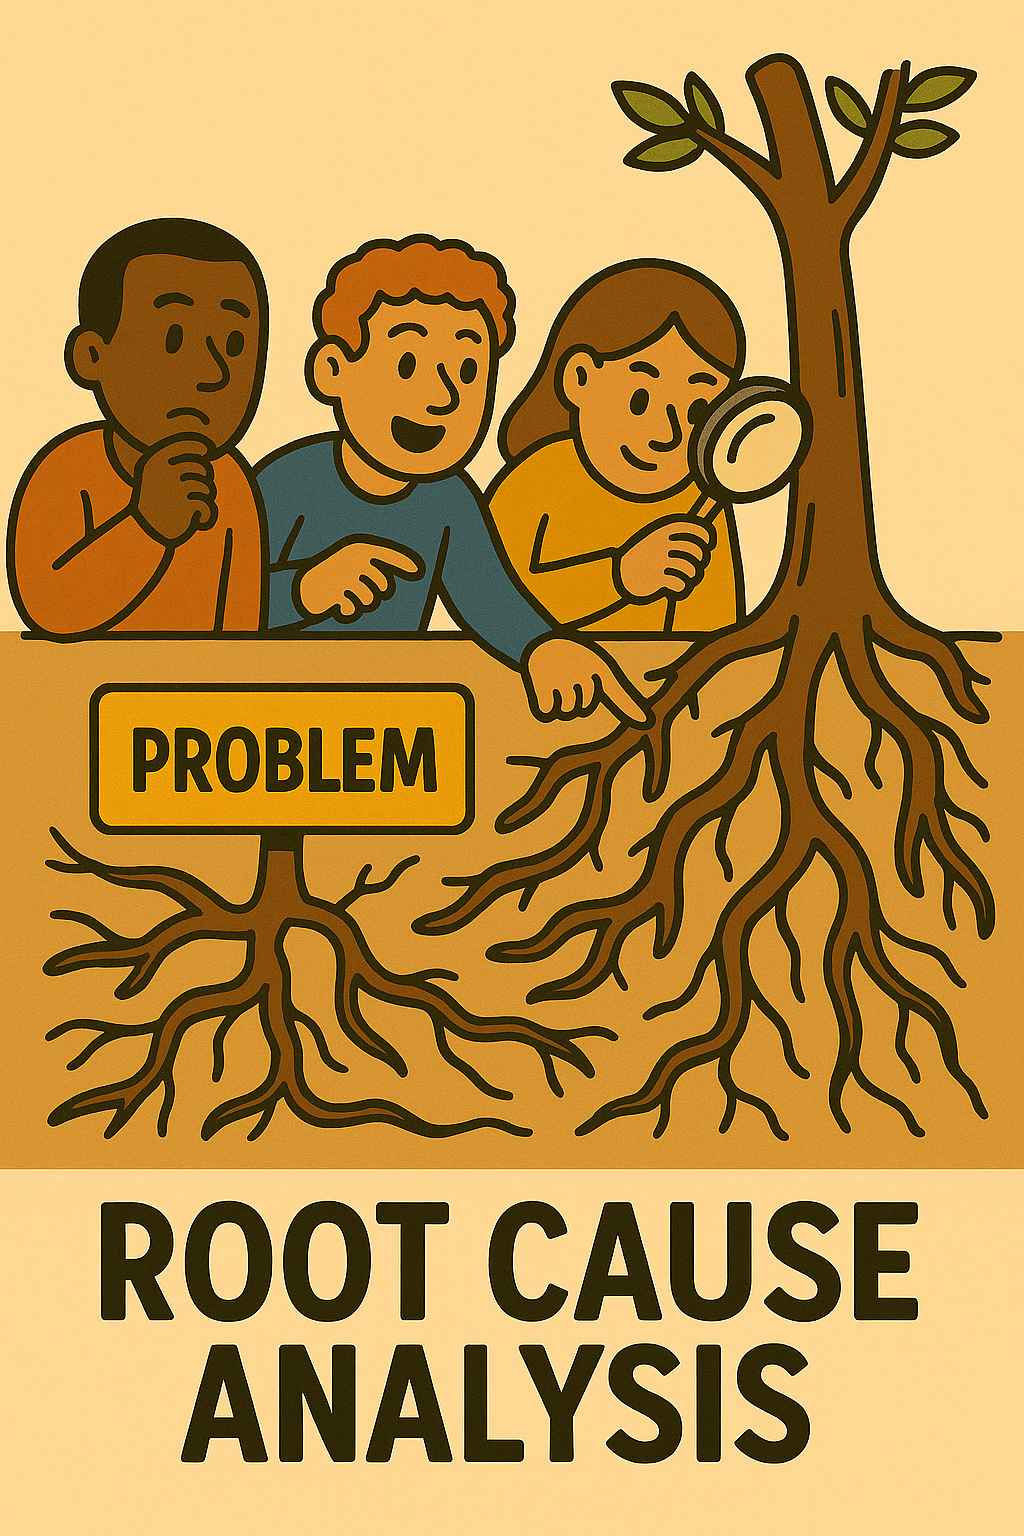
Root Cause Analysis (RCA)
Root Cause Analysis (RCA) is the process of digging beneath the surface of a problem to find the underlying causes so you can address those rather than just treating the symptoms. Instead of stopping at “X went wrong, let’s fix X,” RCA asks “why did X go wrong?” and keeps asking why until the fundamental process weakness or failure in the system is identified.
One common technique for RCA is the 5 Whys: you literally ask “Why?” repeatedly (about five times, as a rule of thumb) until you get to a cause that is actionable and not just another symptom.
For instance:
A machine stopped (problem) why?
Because it overloaded why?
The bearing seized why?
Lubrication was insufficient why?
The automatic oiler malfunctioned why?
It wasn’t on the preventive maintenance schedule.
So a root cause could be “lack of maintenance system for oilers,” which you can fix by creating a maintenance schedule (versus just restarting the machine or replacing the bearing without addressing maintenance).
Other RCA tools include cause and effect diagrams (fishbone diagrams), Pareto analysis to focus on frequent causes, or more advanced techniques like fault tree analysis. RCA should be used whenever there’s a significant problem or recurring issue.
The benefit is that you implement solutions that permanently prevent the issue from happening again, rather than applying band-aids. For example, if a customer got the wrong shipment, you don’t want to just reship (symptom fix), you do RCA and might find the root cause was two look-alike products stored in confusing locations which you then remedy by rearranging and labeling storage.
As a mindset, RCA means treating problems as opportunities to strengthen your process by eliminating the root cause at its source. Practiced consistently, it drives continuous improvement and a culture of not blaming individuals but fixing processes.
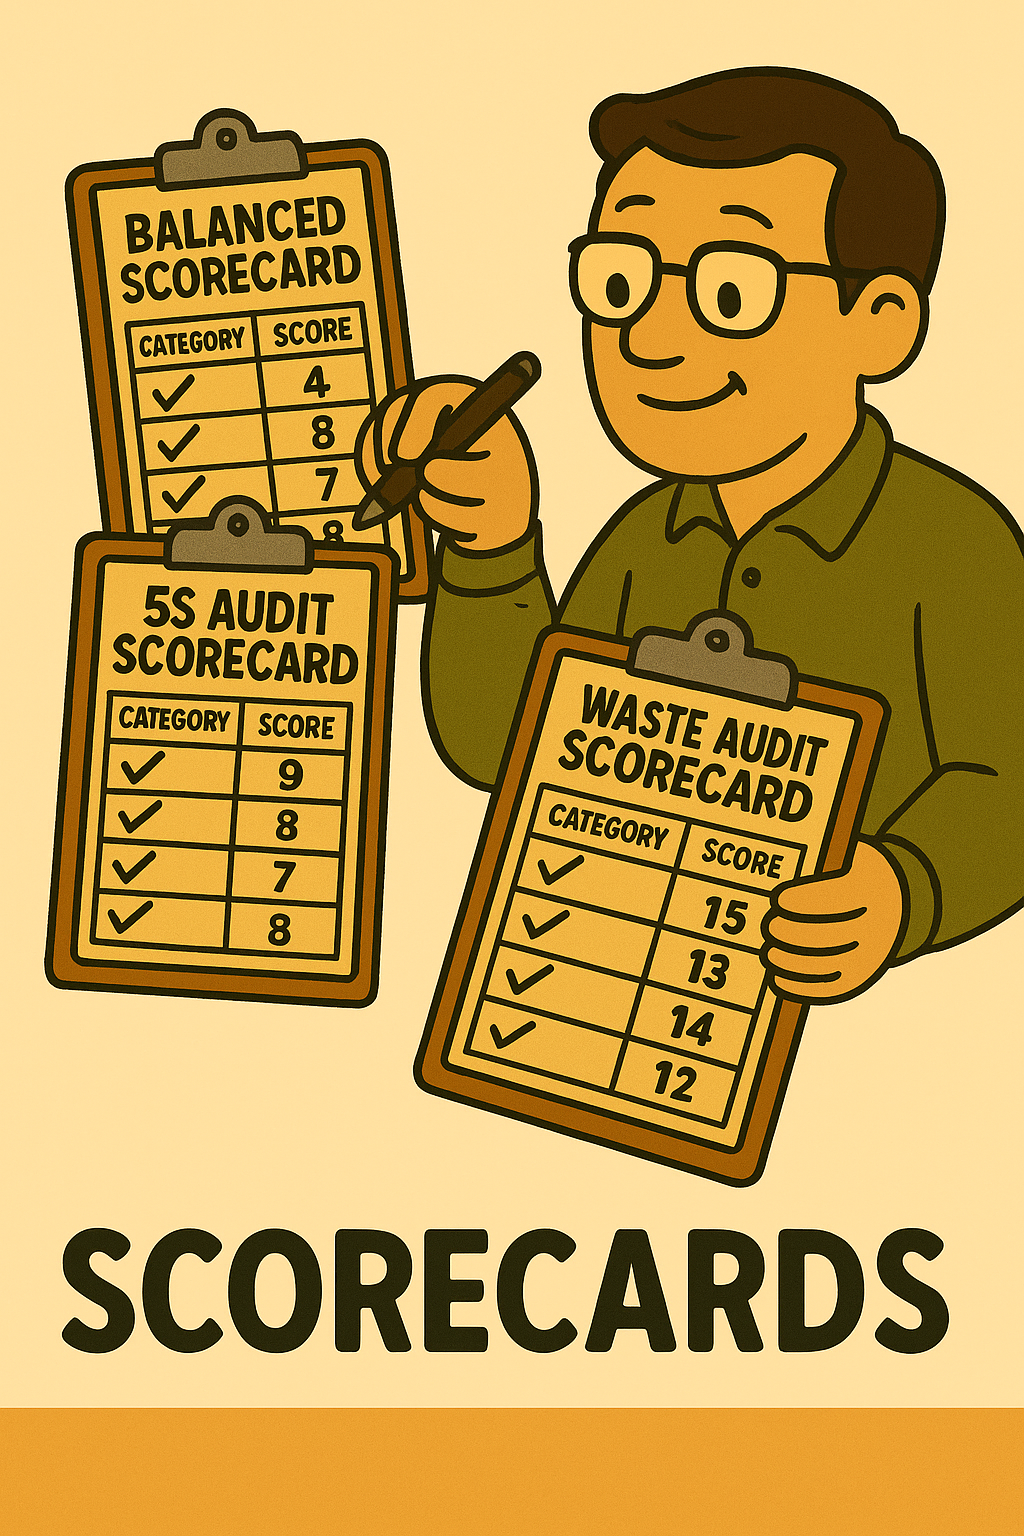
Scorecards
Balanced Scorecard
5S Audit Scorecard
Waste Audit Scorecard
Scorecards in a Lean context are tools used to measure and track performance across various dimensions in a quick, often color-coded way.
Balanced Scorecard
A Balanced Scorecard (BSC) is a strategic management tool that typically looks at multiple perspectives of performance usually financial, customer, internal processes, and learning & growth. Rather than only tracking, say, profit, a balanced scorecard might also track on-time delivery (customer perspective), defect rate (internal process), and training hours or suggestions submitted (learning/growth), giving a more holistic view of how the organization is doing. Balanced Scorecards are used at a high level to ensure improvements in one area don’t undermine another.
5S Audit Scorecard
In Lean implementations, you also encounter more specific audit scorecards, like a 5S Audit Scorecard. This is a checklist or rating system to periodically evaluate how well a team or area is sustaining the 5S principles. It might score items such as “Floors and surfaces are clean (Shine)” or “Items are labeled and stored in designated places (Set in Order)” on a scale, and give an overall 5S score. This helps teams identify where they might be slipping and need corrective action, and also motivates them to keep the workspace neat knowing it will be audited regularly.
Waste Audit Scorecard
Similarly, a Waste Audit Scorecard could be used to assess a process for evidence of the 8 wastes. For example, an auditor or the team might walk through and score how much overproduction they see, or how much waiting, etc. The scorecard approach makes it more concrete and trackable, you could quantify, say, “Motion: score 2 out of 5 (lots of unnecessary walking observed)” and then target that for improvement and see the score go up in the next audit.
In Summary
These scorecards should be used to maintain focus and give feedback. They turn somewhat subjective things into more objective metrics that can be trended over time. For instance, a production cell might start with a 5S audit score of 50% and over 3 months raise it to 90% by addressing findings (tape outlines on floor, labeling, cleaning routines). Management can use scorecards to compare areas and allocate help where needed, or even create friendly competition. The Balanced Scorecard specifically is used at the leadership level to ensure a balanced improvement.
In summary, Lean Scorecards, whether Balanced or specific audits, provide a snapshot of performance in key areas and drive accountability. They are best used as part of regular reviews: e.g. monthly strategy review uses the Balanced Scorecard, weekly 5S audits use the 5S scorecard. The visual nature (often red/yellow/green status) helps quickly identify where attention is needed and keeps everyone aligned on what success looks like in multiple dimensions.
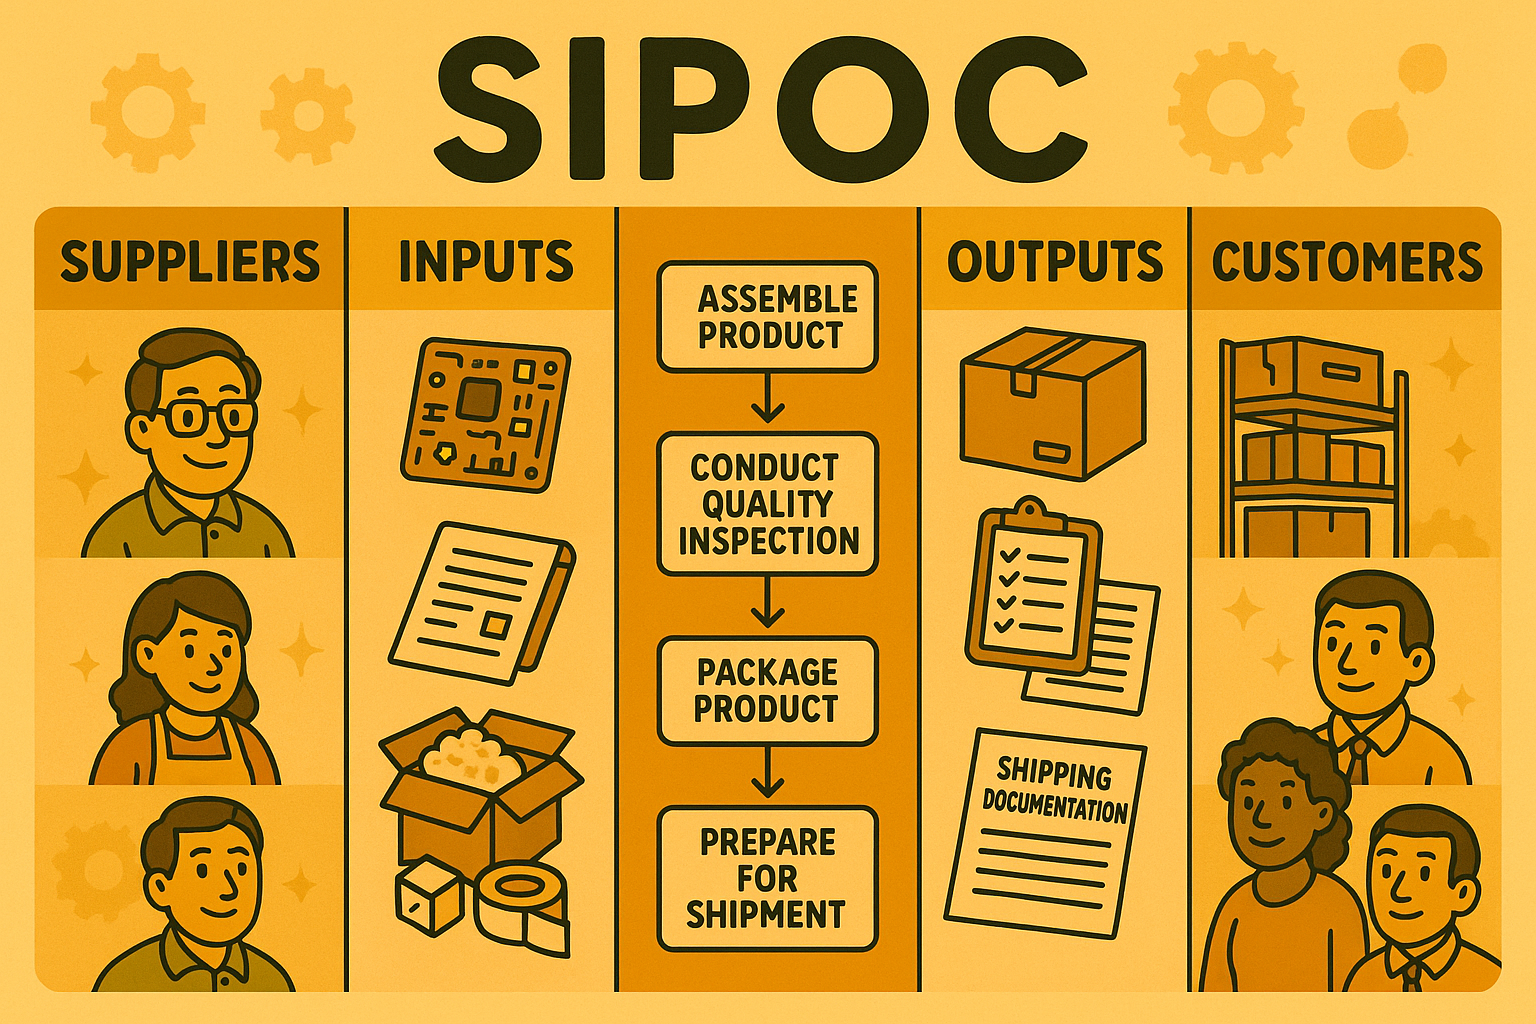
SIPOC (Suppliers, Inputs, Process, Outputs, Customers)
A SIPOC diagram is a high-level overview of a process that outlines its Suppliers, Inputs, Process, Outputs, and Customers. It’s commonly used early in process improvement initiatives especially in the Define phase of Six Sigma to gain clarity on how a process works end to end. Here’s how it applies in a manufacturing context:
Process:
A short description of the manufacturing process you're analyzing (for example: "Assemble and pack electrical components").Inputs:
The materials, tools, and information required to carry out the process (e.g. circuit boards, wiring, assembly instructions, packaging materials).Suppliers:
The people or systems that provide those inputs (e.g. parts vendors, internal warehouse, engineering department).Outputs:
The final items or results the process generates (e.g. assembled product, packaged unit, quality inspection report).Customers:
The recipients of the outputs either internal or external (e.g. shipping department, end customer, quality control team).
By doing SIPOC, you get a clearer scope of the process and its context. It helps ensure that before diving into details, everyone agrees on the boundaries of what’s being discussed. It’s useful for focusing discussions , for instance, are we considering everything up to sending the letter as in-scope? Who are we considering the customer of this process? It also identifies potentially overlooked elements: maybe you realize an important input is slow or of poor quality because of a supplier, which might hint at where problems lie.
Creating one is straightforward, get the team in a room and fill out SIPOC columns, usually starting with Process (5-7 major steps) then filling in outputs and customers, then inputs and suppliers. Once done, you have a one-page summary of the process universe that can be referred back to throughout the project.
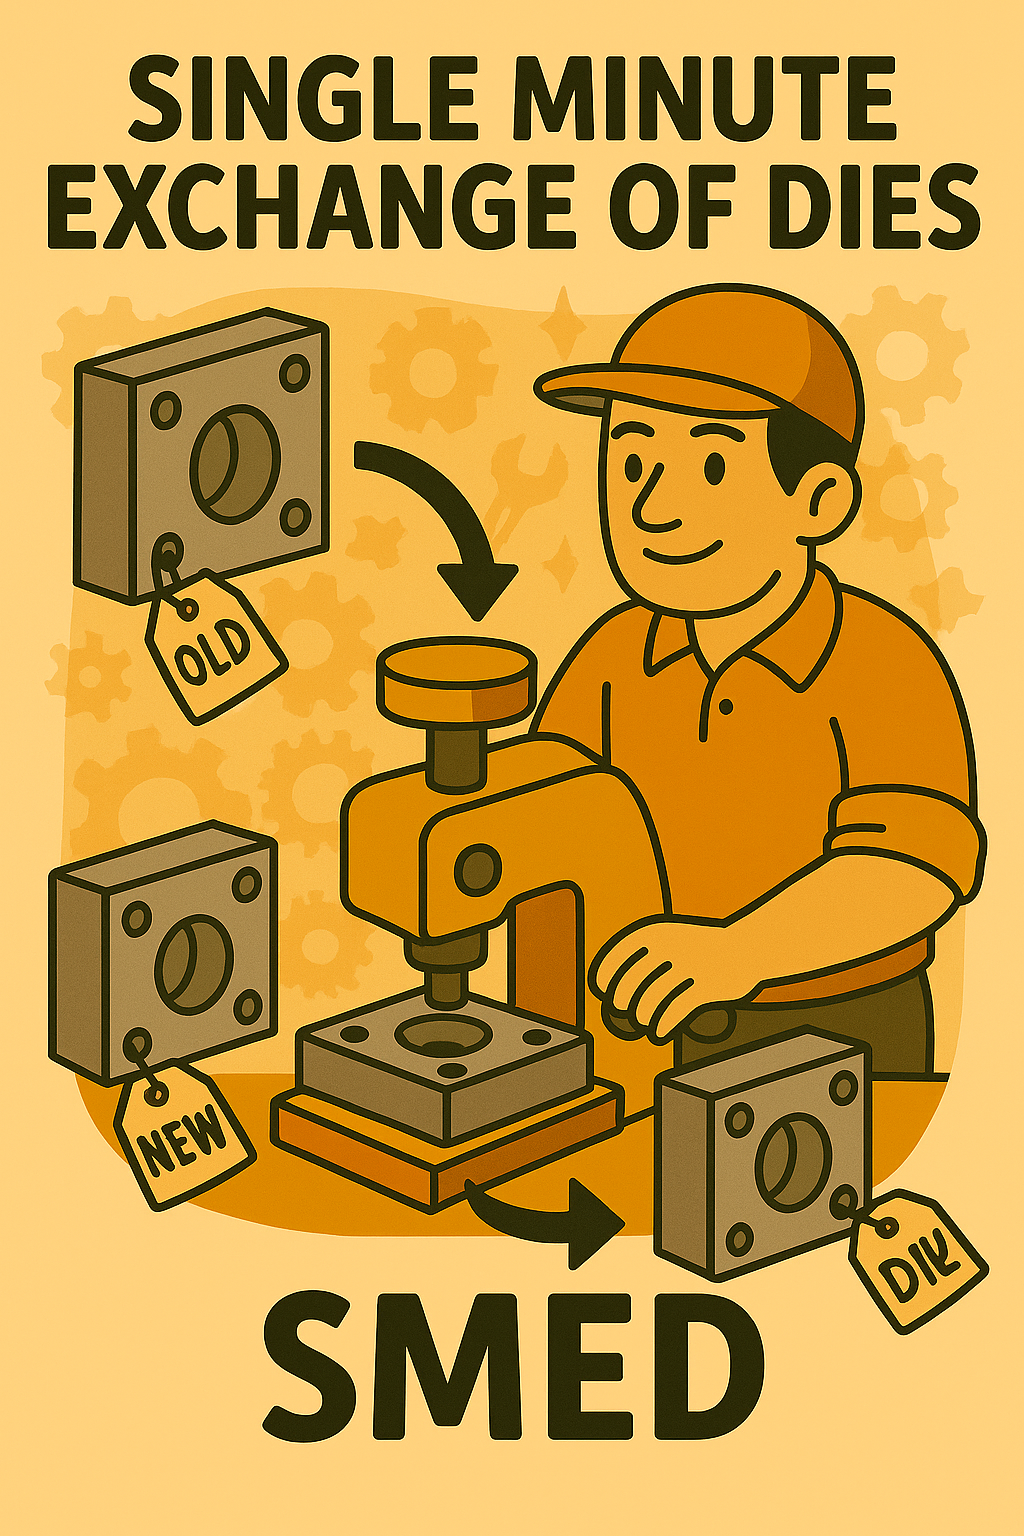
Single Minute Exchange of Dies (SMED)
SMED is a methodology aimed at reducing changeover time (the time it takes to switch from producing one product to another on a machine or line) to single digits of minutes (i.e. less than 10 minutes). The term comes from stamping presses where “dies” needed changing; originally it might take hours, and SMED showed it can often be cut down dramatically. SMED distinguishes between internal setup tasks (that can only be done when the machine is stopped) and external tasks (that can be done while the machine is still running on the previous job). The strategy is to move as many tasks as possible to external, and streamline or eliminate steps altogether.
Typical SMED steps include:
Observe the current changeover process;
Separate internal vs external;
Convert internal to external (e.g. preheat the new mold outside the machine while the machine is still running the current job);
Streamline internal tasks (use quick fasteners like knobs instead of bolts that require wrenches, or use guides and jigs to eliminate trial adjustments);
Improve external tasks (organize tools, have materials staged).
Teams will often videotape a setup and analyze it, it’s not uncommon to find that half the time is spent on things like searching for tools or moving materials around, which can be fixed with 5S and planning.
You should use SMED whenever long changeovers are forcing you into larger batch sizes than you’d like, or causing significant downtime. By cutting setup time, you can economically produce in smaller lots, which supports heijunka (production leveling) and reduces inventory. For example, if it takes 2 hours to change a machine, you tend to run big batches; if you get it down to 10 minutes, you can change more frequently and be more flexible to demand.
As a beginner, SMED is often eye-opening. One might think “this setup simply takes 1 hour by nature,” but SMED workshops often slash that by 50-90%. It can be as straightforward as preparing everything beforehand (like a surgeon’s tools laid out prior to surgery), using quick-release clamps instead of bolted plates, or parallel operations (two people doing different tasks during the downtime instead of one person sequentially).
The result of SMED is not just time saved; it’s that the operation becomes agile, you can respond to a customer order for a different product without dread of a huge downtime. So, SMED is a key enabler for pull systems and just-in-time production, making what was once “setup loss time” almost negligible and thus not a barrier to mixed production.
Shadow Boards
Shadow Boards are visual tool organization boards where each tool has a designated spot marked by an outline (a “shadow”) of that tool. The idea comes from 5S (Set in Order and Shine steps) on a shadow board, you might see a pegboard with painted silhouettes of, say, a hammer, wrenches, and screwdrivers; each actual tool hangs in its matching silhouette spot. This way, anyone can tell at a glance where each tool belongs and whether it’s currently there or missing. The shadow is often a contrasting color (for example, the board is white and the tool silhouettes are black) so it stands out clearly.
The benefit is immediate visual control: if a tool is in use, you see an empty outline, which is fine but reminds to put it back; if a tool is missing entirely, you instantly know which one. It eliminates time wasted searching for tools and also helps in maintaining accountability (if something’s missing, it’s obvious). Shadow boards can be custom made for different sets of tools cleaning equipment might have a shadow board for brooms, dustpans, spray bottles, each with their outline and maybe even labeling.
You should use shadow boards in any workspace (factory, garage, kitchen, maintenance room) where organizing tools and ensuring they return to their home is important. They’re especially common in Lean environments at assembly workstations or machine shops. For beginners implementing 5S, creating a shadow board is a fun and effective Set-in-Order project: once you decide where each tool goes, you literally draw the outline (or use tape or foam cutouts) and that board becomes an easy-to-follow system.
It also improves safety, no tools left on the floor or in incorrect places. And quality, the right tool is readily available, reducing the chance someone uses the wrong tool out of convenience.
So, a shadow board is essentially a place-for-everything approach with visual silhouettes. After using tools, the outlines “ask” for the tools to be put back. If you come to a station and see a missing shadow, you know to go find that tool before starting work or inquire where it is. It’s a simple yet powerful example of visual management where the workspace itself communicates status without words.
Standardisation
Standardisation in Lean means establishing common, best practice ways of doing tasks or processes and ensuring everyone follows them consistently. It’s about creating “one right way” to perform an activity, which becomes the baseline for improvement. Standardisation can apply to many things: the format of work instructions, the layout of workstations, the way metrics are calculated, etc.
The reason standardisation is crucial is that if each person does the same process differently, you get variable outcomes, it’s hard to train new people, and it’s hard to improve because the process isn’t stable. By standardising, you capture the current best-known method, often through Standardized Work documents (which detail the steps, their sequence, the timing, and the standard inventory in-process). It doesn’t mean the standard can’t change, it should, as improvements are made, but at any given time the standard is the reference.
For example, if we standardise the way a call center rep greets a customer and handles a common inquiry, then every rep is delivering a similar experience. We can then measure results and if we find a better way to phrase something, we update the standard so all reps use the improved script. In manufacturing, standardisation might mean every shift sets up a machine in the same manner and order, reducing variability in setup quality.
You should use standardisation after improvements and lessons have identified a good method, to make sure that method is now used every time. It’s also used as a training tool, new employees learn the standard method first. Another facet is standardising across the board, e.g. standardising the way we label files or the way Kanban cards are designed, which reduces confusion and increases efficiency company-wide.
A simple everyday example: think of how recipes standardise cooking, a recipe is basically a standard for how to make a dish, which if followed yields consistent results. In a Lean kitchen, once a recipe is perfected, you expect every cook to use that standard recipe, not wing it their own way, to ensure the taste and quality are uniform.
In Lean journeys, some people initially resist standardisation thinking it reduces creativity or autonomy, but really it’s about reducing unnecessary variation. As the Lean saying goes, “Without standards, there can be no improvement.” You lock in the gains by standardising the best practice, and only then look for the next improvement which might lead to a new standard.
So, standardisation is the backbone of sustaining Lean improvements, it’s how you prevent slipping back into old habits and maintain the improvements (like 5S standards, process standards, etc.). It’s applied through things like checklists, standard operating procedures, visual guidelines, and training, and it touches everything from how meetings are run to how machines are cleaned, all to ensure reliability, quality, and safety.
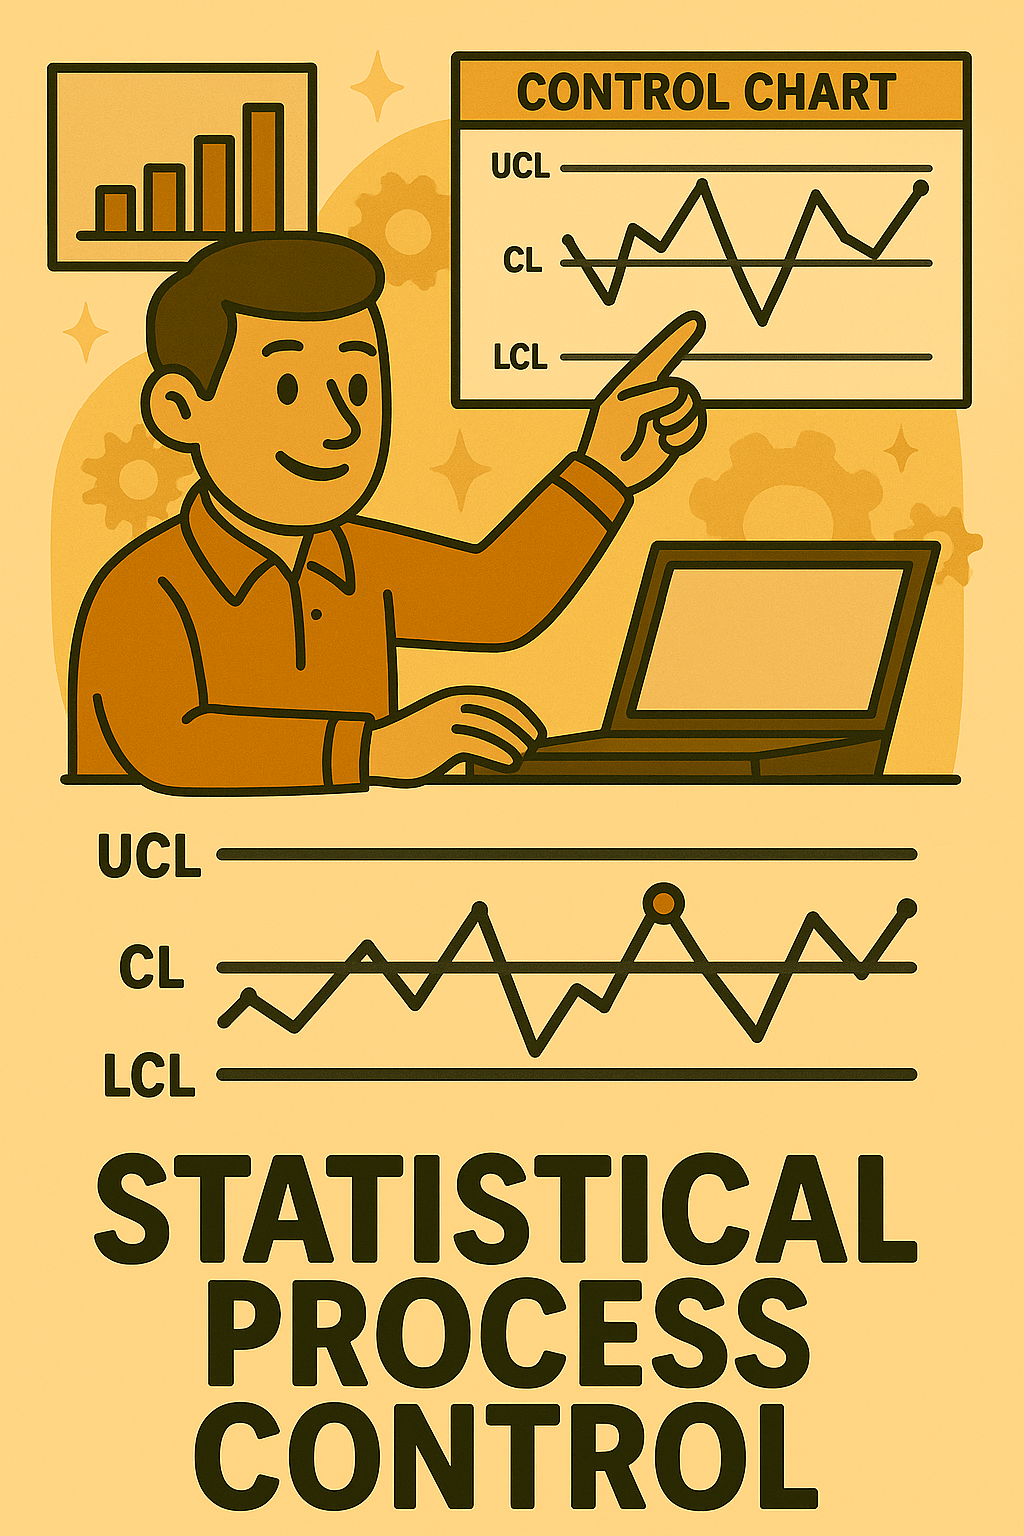
Statistical Process Control (SPC)
Statistical Process Control (SPC) is a method of using statistical tools (primarily control charts) to monitor a process and ensure it operates at its fullest potential by distinguishing normal variation from special causes. Instead of judging process results just against specifications, SPC keeps track of process data over time and raises a flag when the process behavior changes significantly, even if it’s still within spec.
The heart of SPC is the control chart. For example, say you measure the diameter of a turned part for each batch. You plot those diameters on a control chart with the mean centerline and calculated control limits (like ±3 sigma). As long as points fall randomly within the limits, the process is said to be “in control”. If a point falls outside the limits or an unusual pattern appears (like seven points in a row trending upward), that’s a signal of a “special cause” something changed in the process. At that moment, SPC prompts you to investigate and address that cause rather than continuing blindly.
By doing this, you can fix issues before they result in out-of-spec product. Essentially, SPC gives process operators and engineers a real-time feedback loop. It answers: is this variation normal or do we need to adjust the process?
Use SPC on any critical process parameter that, if it drifts, could cause defects or inefficiencies. It’s widely used in manufacturing (temperatures, dimensions, pressures, cycle times) and in transactional processes too. A stable process is a prerequisite to making improvements or tightening tolerances.
A beginner approach to SPC could start with something like a simple X-bar and R chart for a machining operation or a p-chart for tracking daily defect rates in an assembly. Team members would check the chart each time data is added; if it signals, they pause and do a quick root cause check.
The benefit of SPC is it prevents overreaction to noise (don’t tweak the machine every time a slightly different value comes out if it’s within normal variation) and ensures timely reaction to real issues. It shifts quality control from detection (after the fact finding defects) to prevention and early control.
In summary, Statistical Process Control is the application of statistics to measure, understand, and control process variability. It’s a fundamental Lean Six Sigma tool, because reducing variability is monitored by SPC, and keeping processes in control is vital to Lean flow (a wildly erratic process can’t reliably feed the next step). Embracing SPC means you treat process data as a voice telling you how healthy the process is, and you respond to that voice accordingly.
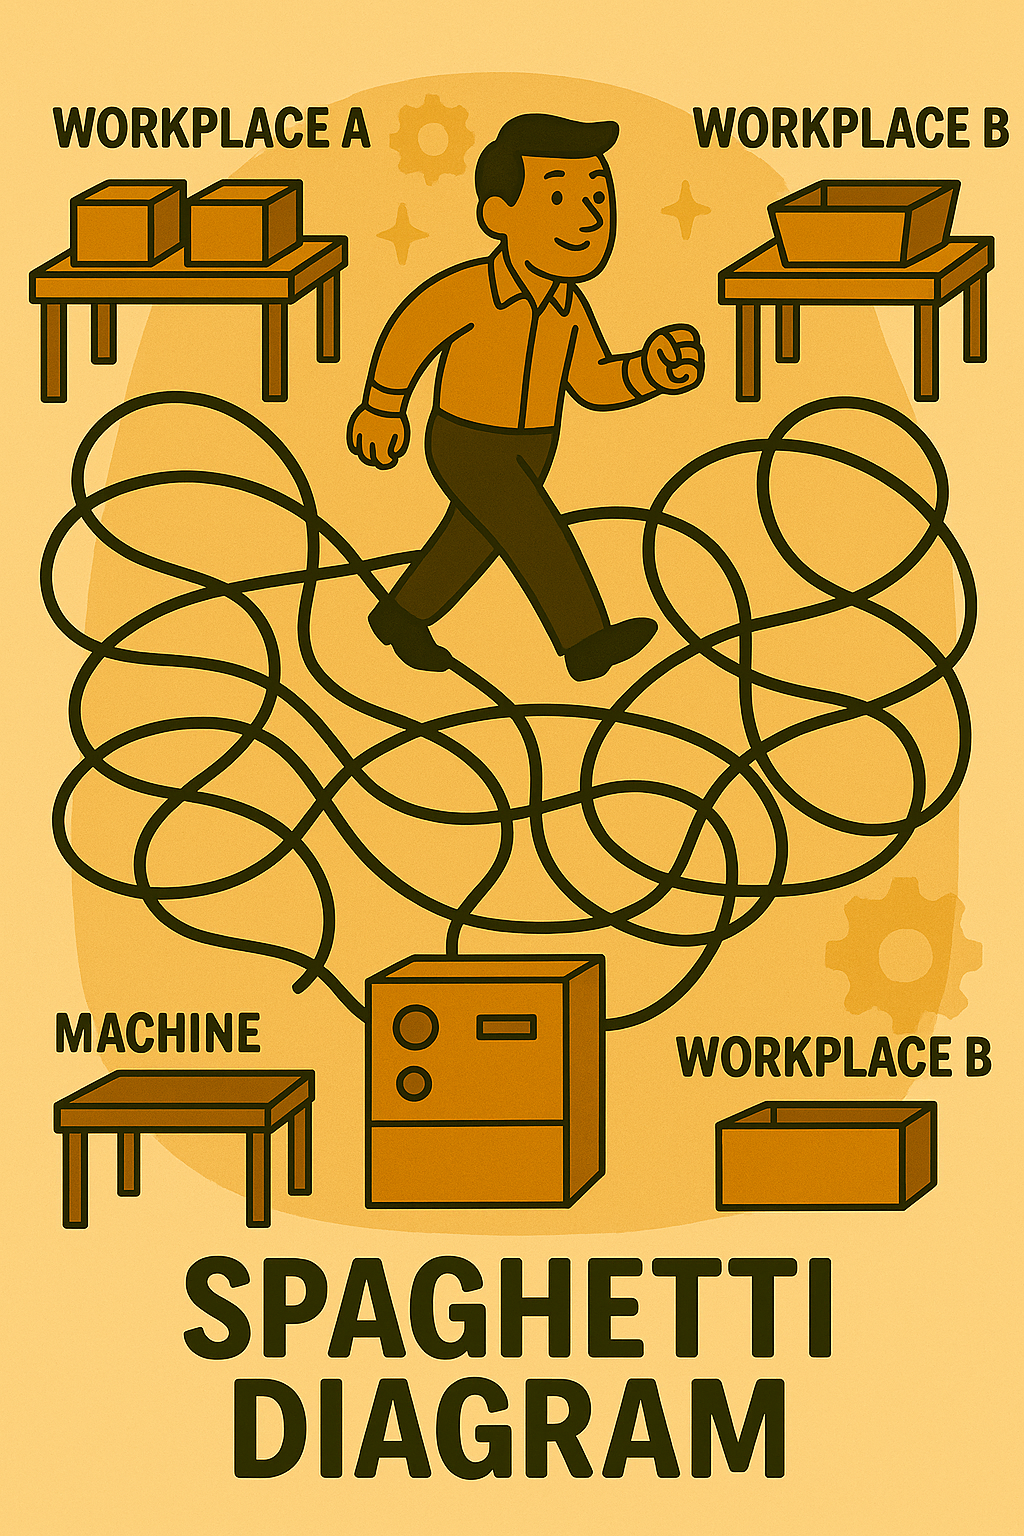
Spaghetti Diagram
A Spaghetti Diagram is a simple visual representation of the path taken by people, materials, or information through a process, it’s drawn by sketching the actual flow lines over a layout, which often ends up looking like a tangled bowl of spaghetti. To create one, you might take a floor plan of a workspace and then literally trace with a pen or pencil the movement of, say, a worker as they complete their tasks or a part as it’s built.
Each time the person walks to fetch something, you draw that line. Often, people are surprised by how far or how back-and-forth the lines go once it’s all drawn, it reveals inefficiencies like unnecessary travel, backtracking, and criss-cross movements.
Spaghetti diagrams are used to identify Motion and Transportation waste in particular. For example, in an office you could do a spaghetti diagram of how an application file moves, maybe you see it goes to three different desks on opposite sides of an office multiple times. In a workshop, you might find a worker’s movement to assemble a product looks like loops between benches because the layout isn’t optimized.
By analyzing the “spaghetti,” teams can redesign the layout or process to simplify the flow (untangle the spaghetti). Maybe that means repositioning equipment closer together in the correct sequence, or bringing frequently used tools to the point of use, or re-sequencing process steps to eliminate back-and-forth.
Use spaghetti diagrams in the early stages of improvement when studying the current state, especially for processes that involve a lot of physical movement. It’s a low-tech, high-insight tool. All it requires is paper, pencil, and observation. Lean practitioners often physically follow a person or item to map it accurately.
The outcome might be changes like: “We realized the worker walked 3 km a day. By moving these two machines adjacent and providing parts at the workstation, we cut that by 80%.” Without the diagram, those movements might not have been fully appreciated.
For beginners, it’s fun and illuminating: pick a simple activity (like processing a patient in a clinic or packaging a product) and map the path of people or items. The spaghetti diagram that results will clearly highlight if, for instance, there’s a lot of crossing pathsmnor just wasted time.
In summary, a Spaghetti Diagram is a straightforward mapping tool that visualizes movement and exposes inefficiencies in layout or process flow. Once you have it, you can work to rearrange things to reduce the spaghetti strands, ideally turning a chaotic scribble into a neat, minimal flow line.
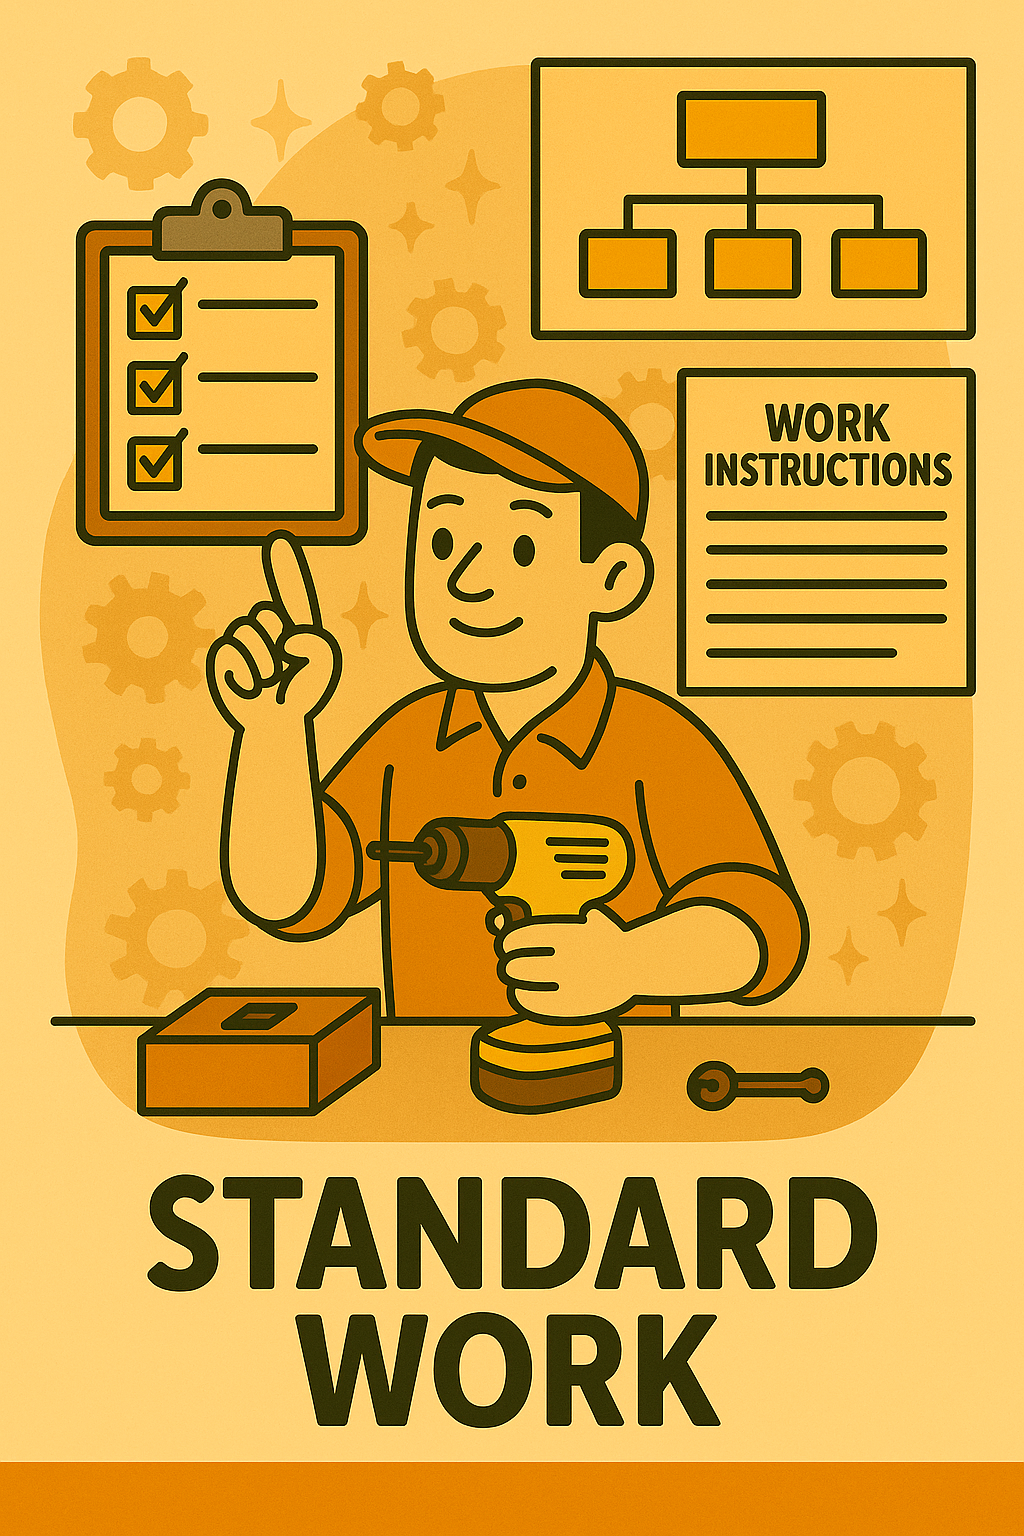
Standard Work (SOP)
Standard Work in Lean is a documented and agreed-upon way to perform a particular task or process that is currently the best known method.
It typically captures three key elements:
The sequence of steps needed to perform the work;
The standard amount of time each step should take;
The standard amount of inventory or materials in process.
By having Standard Work, you ensure consistency, every operator carries out the work the same way, which leads to consistent results and easier training of new people.
Standard Work is usually developed by the people doing the job, often with guidance from a supervisor or process engineer. They might use tools like job breakdown sheets or Standard Work Combination Tables which illustrate the interaction of operator time and machine time.
For example, consider an assembly process with 10 steps: Standard Work would detail those 10 steps in order, perhaps even with diagrams, listing how many seconds each step should take and any key points (like torque values or safety checks). It would also specify that exactly 5 pieces are kept in the small buffer at the station (so that’s the standard WIP).
This doesn’t mean workers are robots, rather, it frees them to focus on quality and improvement because the basics are stable. If an improvement is found (say step 7 can be done quicker with a new tool), then the standard is updated.
You should establish Standard Work once you have a fairly stable process after improvements. It’s the baseline for further Kaizen. Without it, when a problem occurs, it’s hard to tell if the issue was the method or something else, because the method wasn’t consistent.
Standard Work should also include things like quality checkpoints and safety elements often called “key points”. It’s typically posted at the workstation for easy reference.
Another component is Standard Work in Process (the minimum WIP needed to keep the process running smoothly).
Use Standard Work to reduce variability: it eliminates personal “best practices” variations and makes the process clear, which helps new people get up to speed faster. It also reveals abnormalities immediately, if a step normally takes 30 seconds and now it’s consistently taking 50, you know something changed.
For beginners, writing down a simple Standard Work for a routine task (even in a simple task) is a great exercise. It forces understanding the process deeply. Then you can often spot wastes or unnecessary steps in that process.
In summary, Standard Work is the documented current one best way to do a job, including the time and resources involved. It is a living document, continuously improved as better ways are found, but rigidly followed in between improvements. It’s foundational for Lean because it brings stability and repeatability, which are prerequisites for quality and improvement.
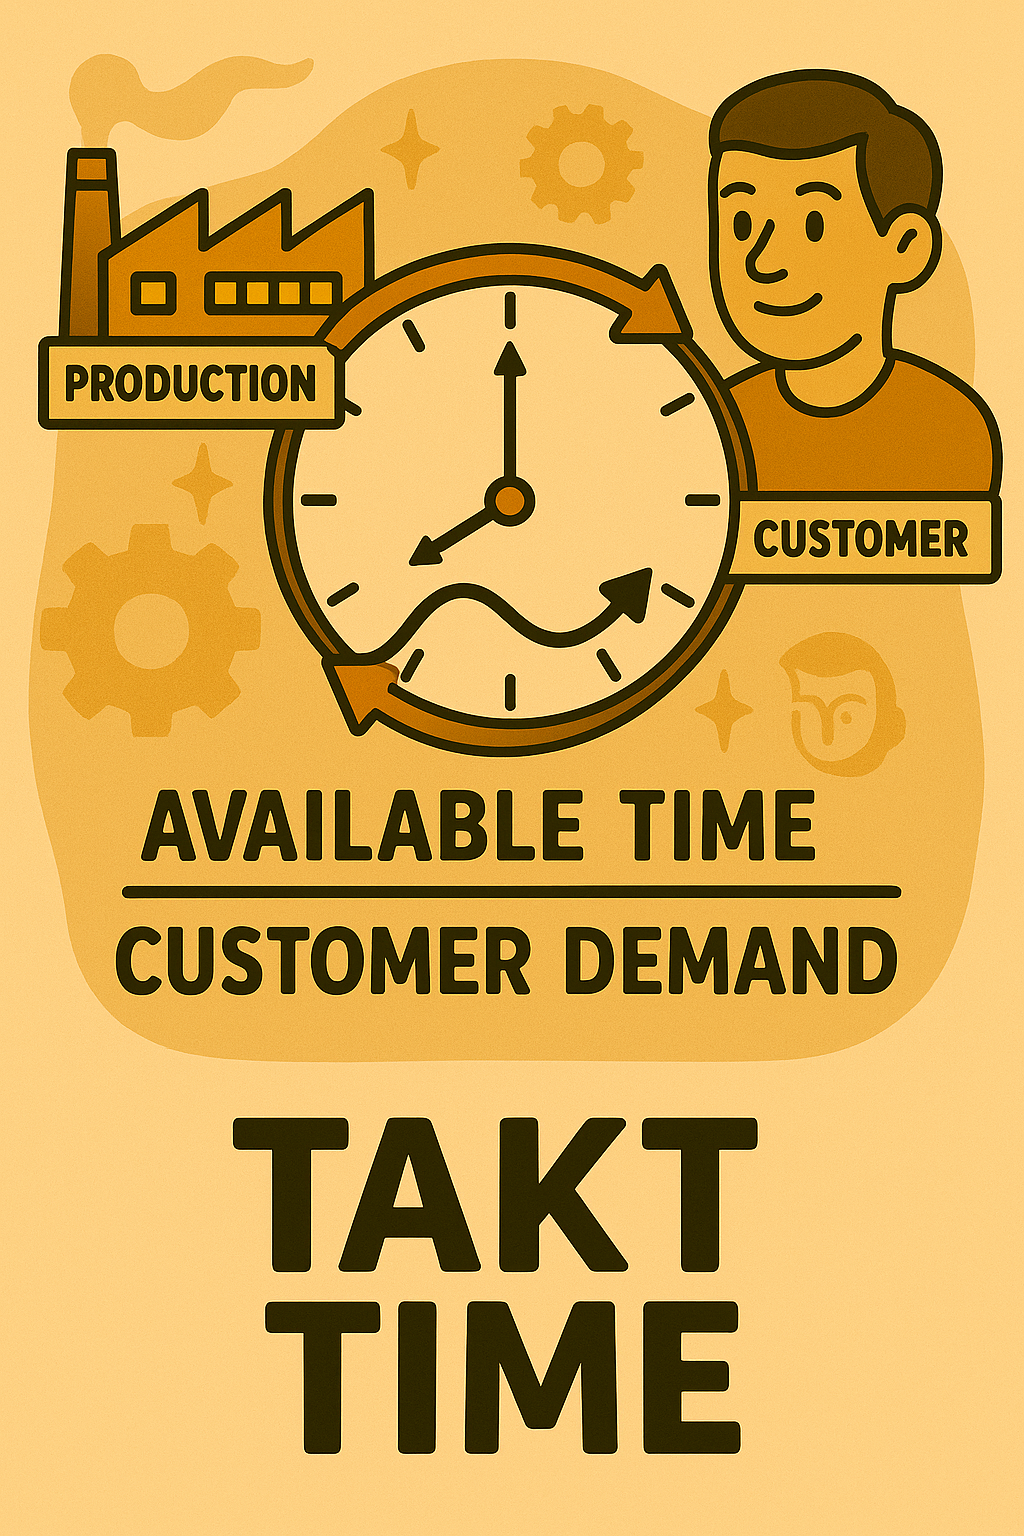
Takt Time
Takt Time is the rate at which you need to complete products or services in order to meet customer demand, aligning production with the rhythm of sales. It comes from the German word for a musical meter; think of it as the “beat” of production. The formula is usually:
Takt Time = Available Production Time / Customer Demand.
For example, if you have a workday of 480 minutes and customer demand is 240 units per day, then takt time is 480/240 = 2 minutes per unit. That means, on average, a finished unit should be coming off the line every 2 minutes to meet demand (one unit every 2 minutes keeps pace with orders).
Takt Time is a planning number. It’s used to design and balance processes. If one assembly line station is taking 3 minutes when takt is 2 minutes, that station is a bottleneck and you either need to improve it, add resources, or break up the work differently. Ideally, each step in a balanced production line would be very close to the takt time so work flows smoothly without waiting or overproduction.
Important: takt time is driven by demand, so if demand changes, takt changes. It’s about pacing so that you produce just the right amount, not too much (overproduction) and not too little (shorting the customer or creating overtime). If demand drops, takt gets longer (slower beat); if demand rises, takt gets shorter (faster beat), and you might need to increase capacity accordingly.
In a service context, takt time could be used like: if a call center gets 120 calls an hour, that’s 30 seconds per call as the takt (3600 seconds/120). That informs staffing and call handling processes.
When implementing takt time, you often literally communicate it visibly, e.g. a pace clock or a chart on the floor. Operators might use a metronome like signal or simply be trained to that pace.
Beginners can calculate takt easily: figure out how much time you really have for value-added work (subtract breaks, etc.) and divide by how many units the customer needs in that time. Many are surprised by the result, sometimes processes are way under or over-paced relative to takt, which leads to issues like waiting or overtime.
Use Takt Time as a fundamental design parameter for Lean systems. It’s critical for one-piece flow and pull: everything is structured around meeting the takt. It helps right-size everything from staffing, equipment requirements to batch sizes and inventory buffers.
If there’s a deviation from meeting takt in actual production (e.g. a downtime causes you to fall behind), that’s a signal to problem-solve because it means customer demand won’t be met unless corrected.
In short, Takt Time is the heartbeat of a Lean operation, synchronizing production with demand. It tells you “we need to complete one unit every X amount of time” and the entire production system is organized to achieve that steady rhythm.
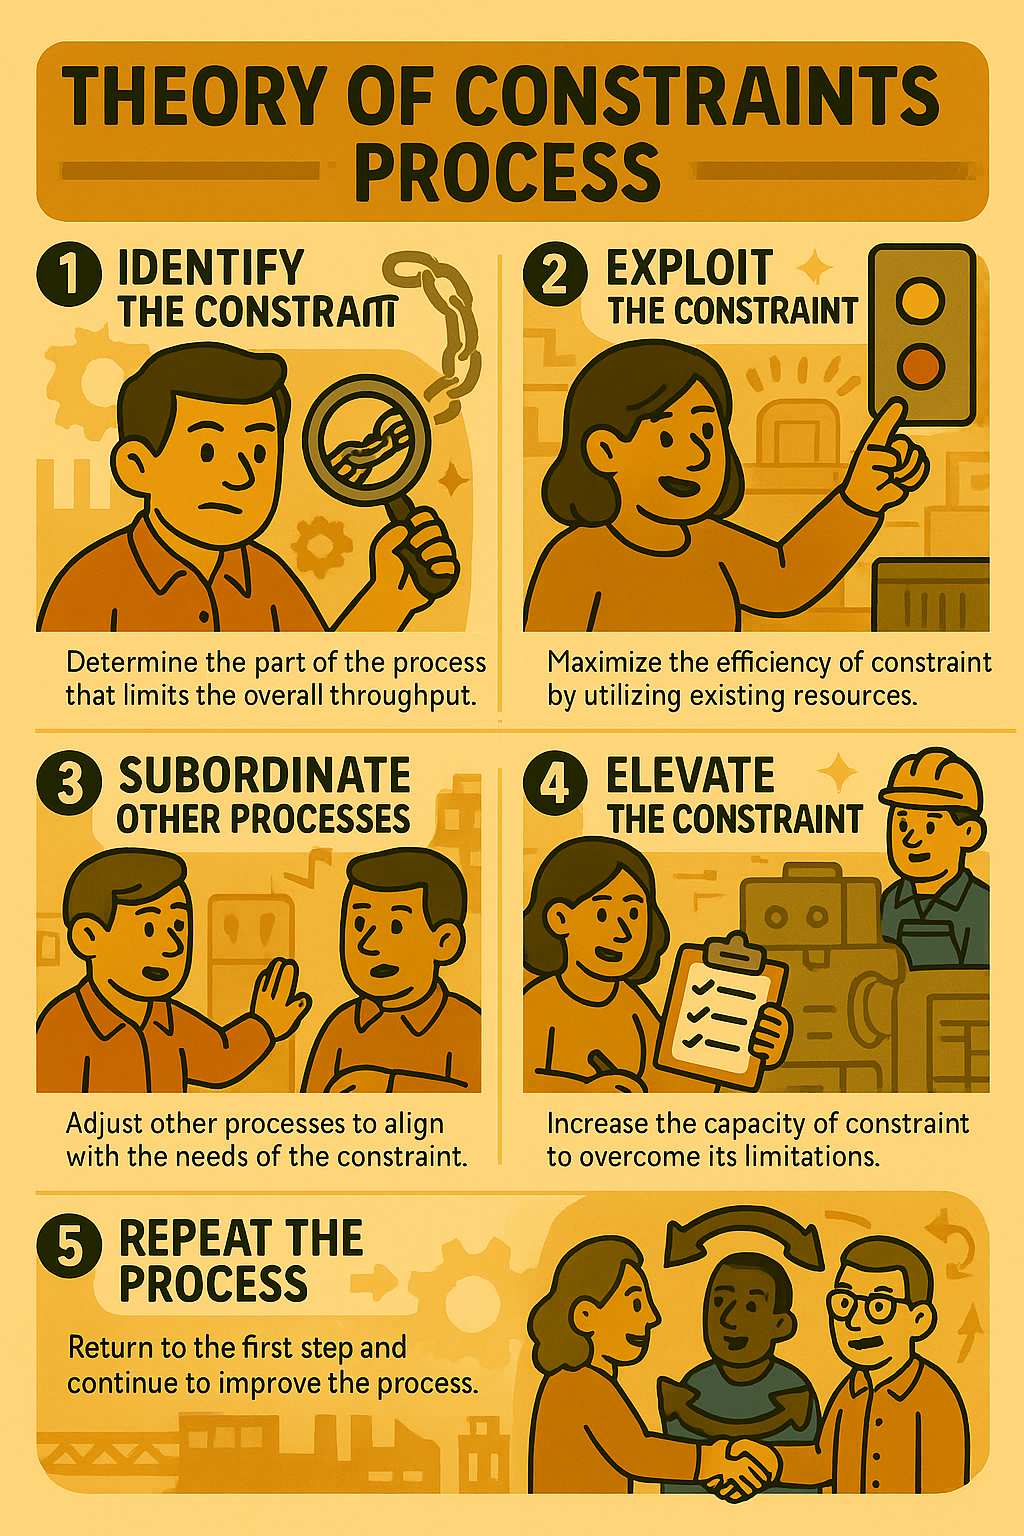
Theory of Constraints (TOC)
The Theory of Constraints (TOC) is a management philosophy that states any system has at least one constraint (bottleneck) that limits its output, and to improve the system’s performance, you must identify and manage that constraint. It’s often summarized as: strengthen the weakest link in the chain. TOC provides a focusing process: find the bottleneck (the process step with the least capacity or biggest backlog), decide how to exploit it (ensure it’s as efficient as possible), subordinate everything else to that (align the rest of the process to support the bottleneck’s pace), elevate the constraint (add capacity or other major changes if needed), and once it’s no longer the constraint, find the next one, and so on.
In practical terms, imagine a manufacturing line where one machine can only do 50 units/hour but all others do 80. That machine is the constraint; no matter what you do upstream or downstream, you can’t do more than 50 units/hour overall. TOC would have you focus your improvement efforts there: reduce its downtime, maybe run it extra shifts, or improve its speed. Also, don’t let other non-constraint processes overproduce (they’d just build inventory waiting on the bottleneck). In Lean terms, TOC and Lean align by making bottlenecks visible and avoiding overproduction.
A classic TOC tool is Drum-Buffer-Rope: the drum is the beat of the constraint (it sets the pace), buffers are placed before the constraint to ensure it never starves (a bit of protective inventory), and a rope is a pull signal from the constraint to upstream to release material so that upstream doesn’t go faster than the drum.
You should use TOC thinking when planning production or when one part of your process clearly is slower; it’s a way to prioritize improvements. Instead of trying to marginally improve everything, you get the biggest bang by improving the constraint. Also, if you can’t yet improve it, you protect it (make sure it’s always working on value e.g. don’t let it wait on parts or run out of work).
Another scenario: in a service like loan processing, maybe underwriting is the bottleneck (1 underwriter can approve 5 loans/day, other steps can handle more). So the system can’t do more than 5/day unless you focus on underwriting (maybe add another underwriter or simplify criteria). Meanwhile, there’s no sense in sales bringing 10 applications/day if underwriting can only do 5, that would just pile up.
TOC isn’t at odds with Lean; they complement. Lean tends to even out flow and remove waste broadly, but when a specific constraint is glaring, TOC says “fix that first” because only then will overall throughput increase. After that’s fixed, something else will become the new constraint (maybe shifting to another machine or step), which becomes the next improvement focus.
In summary, the Theory of Constraints is about system optimization by continually identifying the bottleneck and working to alleviate it. It reminds us that working on non-constraints yields only minor local benefits, whereas improving the constraint yields major global benefits (like higher throughput, faster delivery). Therefore, always know where your constraint it, it’s the lever for major improvement.
Total Ownership
Total Ownership in a Lean culture context means that every employee takes complete responsibility and “ownership” for the processes and work they are involved in, as well as for solving problems and improving those processes. It’s the idea that problems are “mine to fix,” not “someone else’s issue.” When total ownership is embraced, operators feel as much accountability for quality, cost, and delivery as their managers do, and support staff feel responsible for enabling operators, and so on up the chain. It’s somewhat analogous to the concept of “ownership culture” where each person behaves like an owner of the business in terms of caring about outcomes, rather than just doing the bare minimum.
In practical terms, fostering total ownership might include: operators being given the training and authority to stop the line if something’s wrong (ownership of quality), maintenance teams feeling responsible not just for responding to breakdowns but for preventing them (ownership of equipment uptime), and office employees treating internal requests with the same diligence they’d treat a customer’s (ownership of service). It’s closely tied to empowerment and trust management must give employees the authority and information to make decisions, and employees must step up to that responsibility.
One example: At a Lean company, if a piece of trash is on the floor, anyone who sees it picks it up (they own the workplace cleanliness) instead of thinking “It’s not my job, that’s the janitor’s job.” Or if a production cell misses its target, the whole team feels the miss and works collaboratively to find and fix the cause, instead of shrugging and waiting for engineering to fix it.
To implement total ownership, leadership has to encourage involvement and show that contributions are valued. Techniques like visual management and team huddles help because everyone can see issues and take ownership of them together. Suggestion systems are another facet: when employees submit improvement ideas, it shows they are taking ownership for making things better.
The term could also imply “Total Cost of Ownership” in other contexts (like considering all costs over a product lifecycle), but in Lean practice here it likely refers to the cultural aspect described.
Why is it important? Because Lean thrives in a culture where people don’t pass the buck. If something goes wrong, total ownership means the focus is on “How do we solve it and prevent it?” rather than “Who’s fault is it?” or “Not my problem.” It leads to faster problem resolution and continuous improvement at all levels because everyone is engaged.
For beginners, adopting total ownership might mean a mindset shift: treat your process as if you own that mini-business. If a defect goes to a customer, you personally feel responsible. If something can be improved, you feel it’s on you to speak up or try something. When everybody does that, the organization can tackle issues with all its brainpower and not just rely on a few managers.
In essence, Total Ownership in Lean is about taking initiative and responsibility for everything in your work environment and not waiting for someone else, it’s the opposite of “that’s not my job.” It creates a proactive, problem-solving workforce which is exactly what a Lean enterprise needs to sustain improvements and adapt to change.
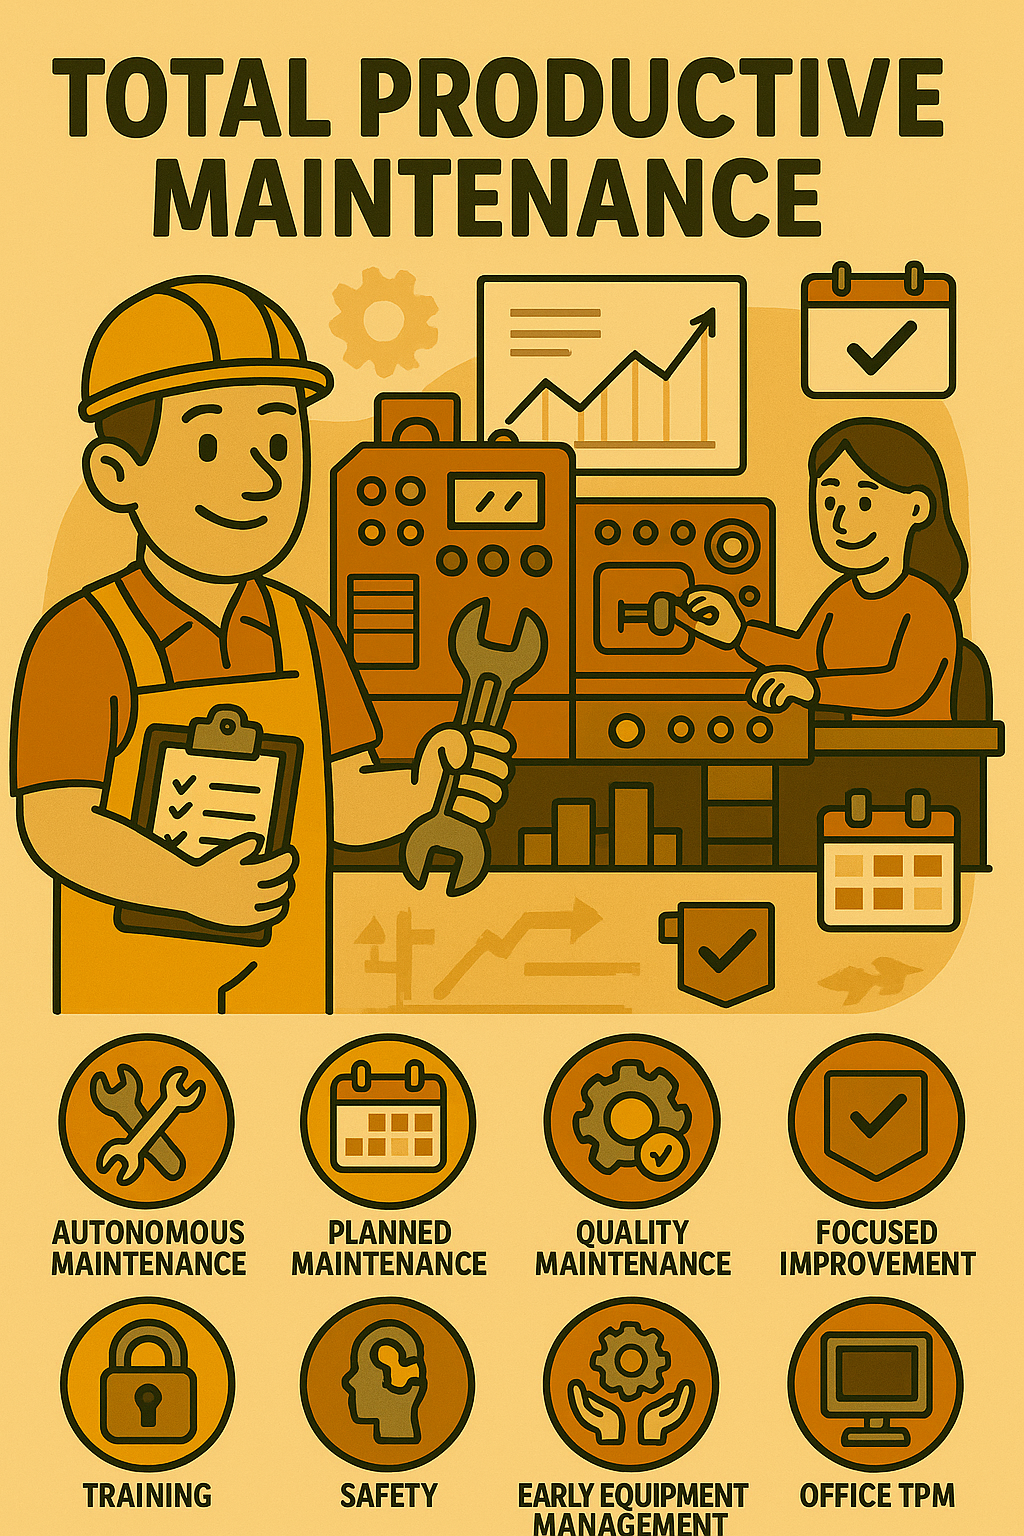
Total Productive Maintenance (TPM)
Total Productive Maintenance (TPM) is a holistic approach to equipment maintenance that aims to achieve perfect production (no breakdowns, no small stops, no defects, no accidents) by involving all employees in maintaining equipment and optimizing its reliability. The word “Total” signifies that it’s not just the maintenance department’s job; operators, maintenance techs, and management all play a role. TPM has a set of pillars (often 8 pillars in modern interpretations) including Autonomous Maintenance (operators caring for their machines daily), Planned Maintenance (scheduled preventive maintenance), Quality Maintenance (preventing defects through maintenance), Focused Improvement (cross-functional teams work on eliminating chronic issues), Early Equipment Management (designing reliability into new equipment), Training and Education, Safety & Sustained Success, etc.
One key concept is Autonomous Maintenance: operators are trained to do basic upkeep, cleaning, lubricating, inspection, on a regular basis so that equipment stays in good condition and small issues are caught early. This both empowers operators and frees maintenance specialists to focus on more complex tasks and improvements. It also builds operator ownership of the machine (they can notice when something’s “not quite right” because they interact with it closely every day).
TPM’s goal is to maximize OEE (Overall Equipment Effectiveness) by attacking the six big losses (breakdowns, setup/adjustments, small stops, reduced speed, startup rejects, and production rejects). It transitions maintenance from reactive (fix after break) to proactive (prevent breaks) and even predictive.
You should use TPM if equipment downtime or performance issues are a significant source of waste in your operations. In Lean manufacturing, reliable equipment is crucial for flow and Just-In-Time; random breakdowns cause big disruptions. TPM addresses that by systematizing maintenance and engaging everyone in it. For example, a factory might put in place daily 5-minute equipment checks for operators, weekly maintenance team check-ups, and visual controls (like charts on the machine showing last lubrication date).
For beginners, a common way to start TPM is with 5S on equipment (clean it thoroughly, which often reveals hidden problems like oil leaks, then make it easy to keep clean and check via visual markings, etc.) and some basic training for operators on how to tighten, lubricate, or replace simple parts. It builds from there: small group activities might tackle a chronic machine issue as a kaizen, applying focused improvement to eliminate root causes.
TPM also emphasizes safety, well-maintained machines are safer, and one of TPM’s pillars is a safe working environment.
So, Total Productive Maintenance transforms maintenance from a necessary evil into an integral part of operations and continuous improvement. It blurs the line between “production” and “maintenance” roles, fostering collaboration to keep equipment at peak condition. The payoff is fewer breakdowns (increasing uptime), better quality (machines stay calibrated), and typically a more engaged workforce (operators feel pride in “their” machine). In short, TPM is Lean applied to maintenance, eliminate the wastes and losses associated with equipment life cycles by making maintenance everybody’s responsibility and priority.
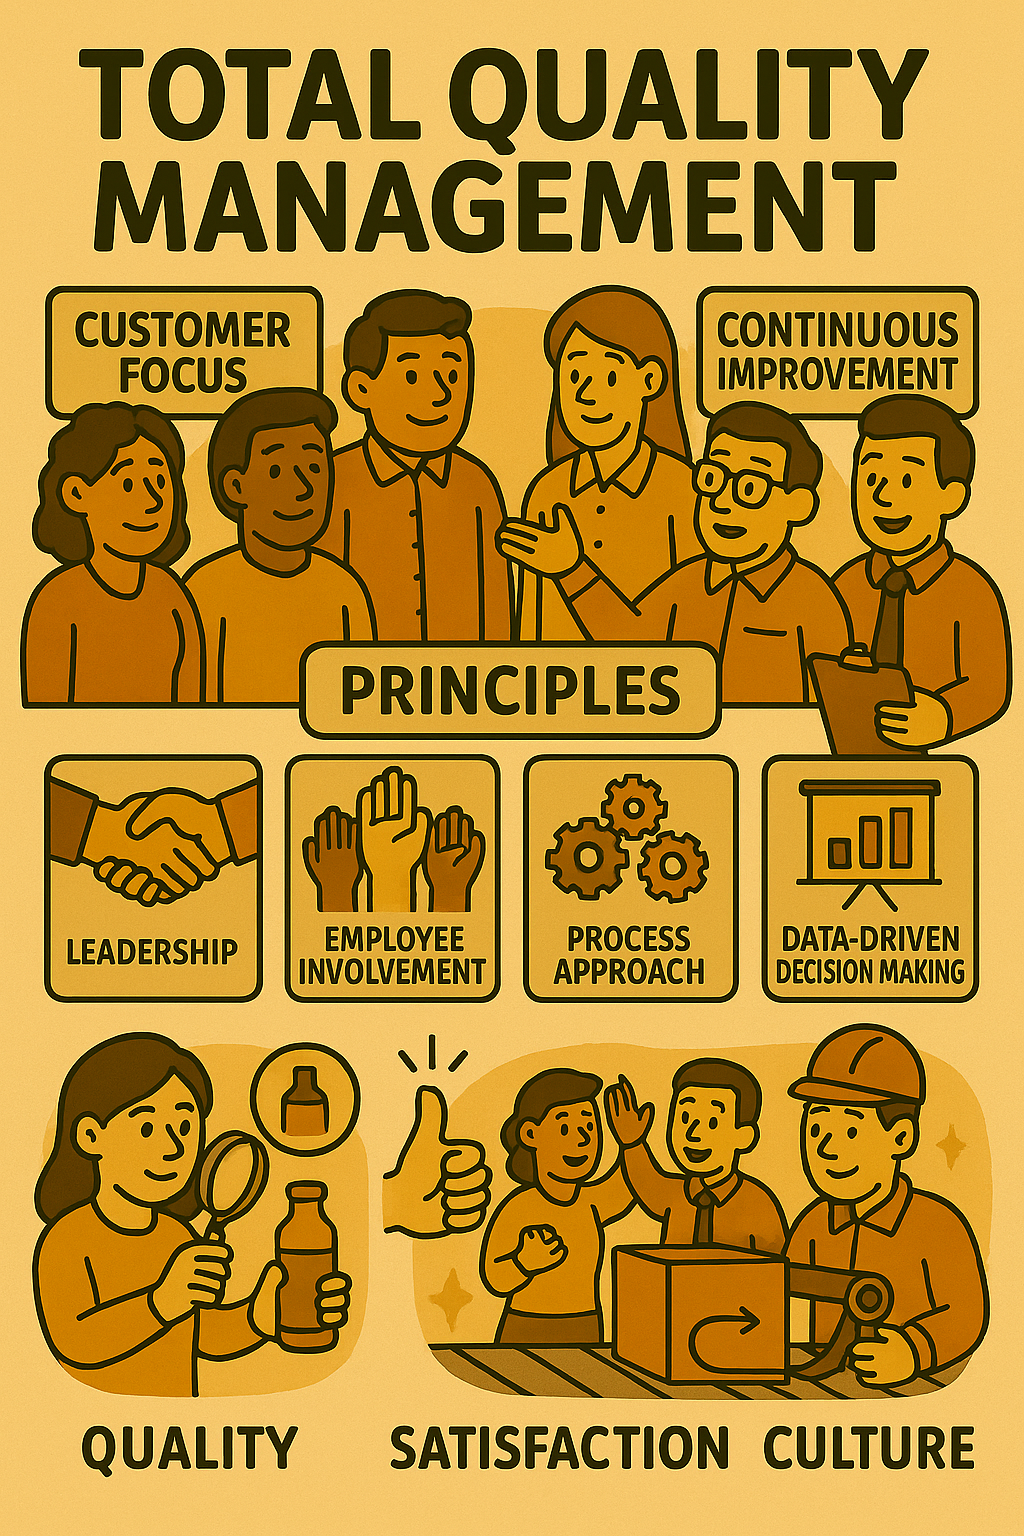
Total Quality Management (TQM)
Total Quality Management (TQM) is a management approach that emerged primarily in the 1980s and 1990s, focusing on long-term success through customer satisfaction and continuous improvement of all organizational processes. Total means it involves all departments and employees, Quality means meeting or exceeding customer expectations, and Management means it’s an integrated strategy led from the top. In practice, TQM emphasizes that quality is not just the role of a quality control department, but the responsibility of every person at every step of the process.
Key principles of TQM include: a strong customer focus (understand both internal and external customer needs), process orientation (view work as processes that can be improved), integrated system (everyone understands the vision, mission, and quality goals), continual improvement (using tools like PDCA, root cause analysis, etc. in an ongoing way), data-driven decision making (relying on facts and analysis), and effective communication.
Many quality gurus (Deming, Juran, Crosby) influenced TQM. For example, Deming’s 14 points largely shaped TQM philosophy, such as breaking down barriers between departments, ceasing mass inspection in favor of building quality into the process, and driving out fear so everyone can work effectively for the organization.
A TQM initiative might involve establishing quality circles (small groups meeting to solve work-area problems), training everyone in basic quality tools, implementing suggestion systems, and aligning performance measures with quality metrics (not just output). It also often entails recognition that improving quality reduces costs (less rework, more customer loyalty) rather than increasing costs.
You should think of TQM historically as a precursor or foundation to Lean and Six Sigma. It laid the cultural emphasis on quality and continuous improvement that Lean and Six Sigma methods then operationalized more concretely. Many organizations first tried TQM as broad culture change programs. Some succeeded, building an enduring culture of continuous improvement; others floundered if it stayed too theoretical. But the key lesson is involving everyone and focusing on the customer.
If a company is pursuing TQM, a beginner might experience it as being part of a cross-functional improvement team, or receiving training on quality management principles, or being empowered to stop a process if there’s a quality issue (similar to Jidoka).
The difference between TQM and Lean might be subtle, Lean is very action and waste-focused, whereas TQM is a bit more general about quality and can include more statistical or customer-service aspects. However, they’re complementary and share goals.
In summary, Total Quality Management is about embedding a quality-centric mindset in every aspect of the organization’s operations, with the belief that this will lead to long-term success through happy customers. It’s “total” because it requires total commitment from everyone and addresses quality in everything the company does, from product design to administrative processes to after-sales service.
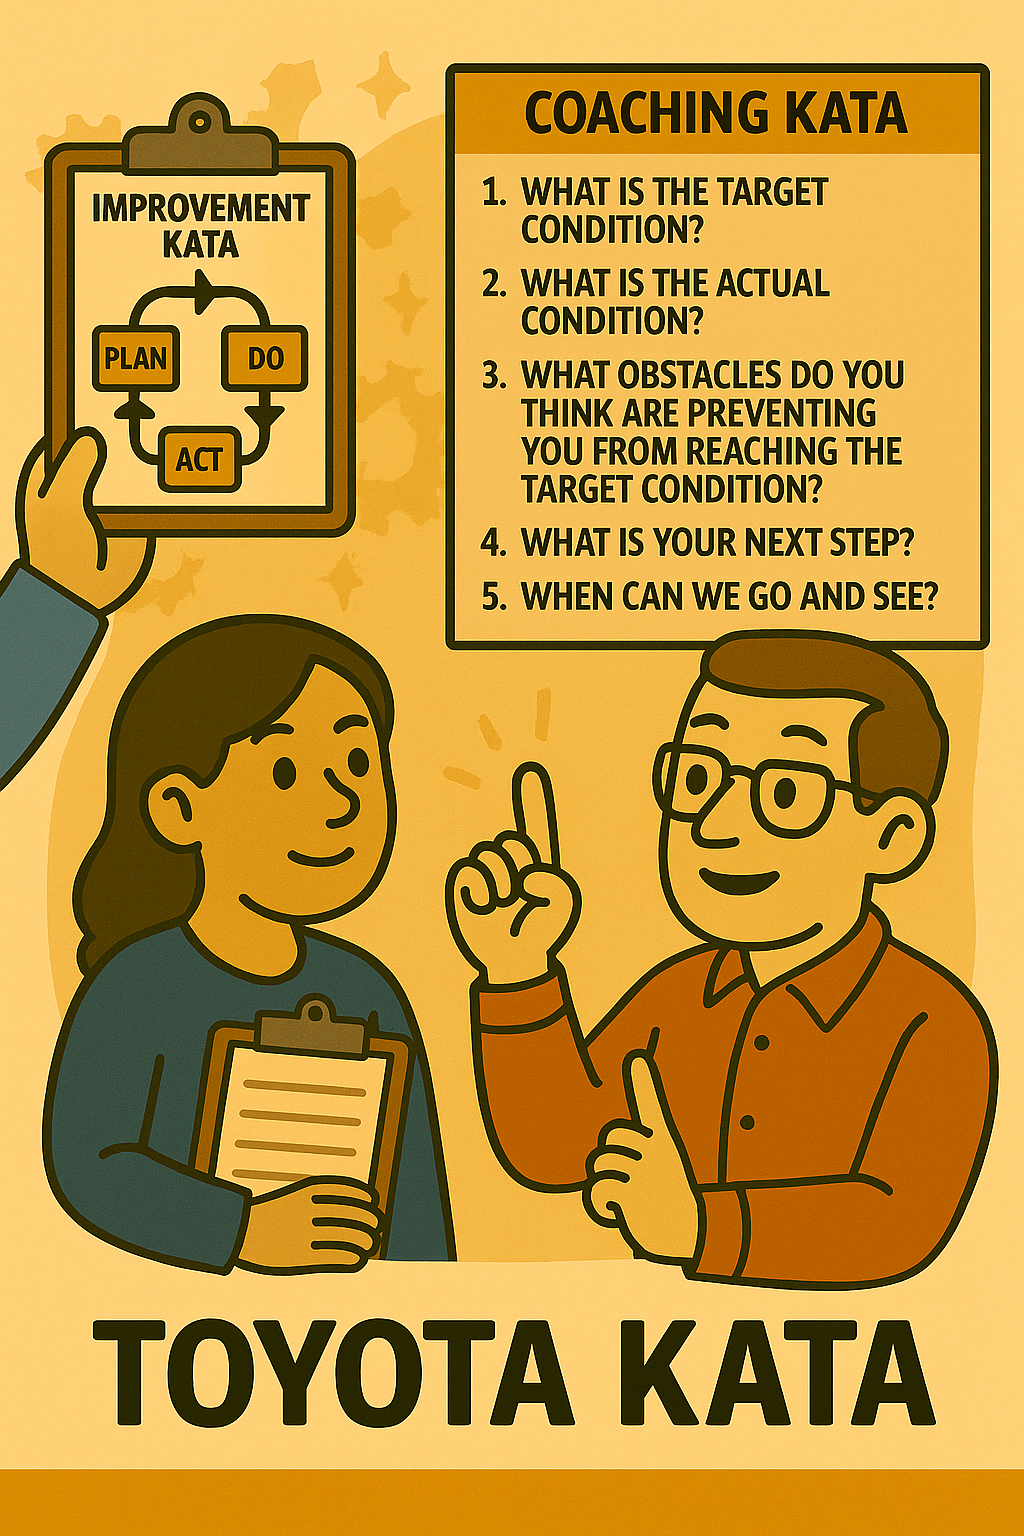
Toyota Kata
Toyota Kata refers to a management and team pattern of behavior that Toyota uses to instill continuous improvement and adaptive learning into its culture. The concept was popularized by Mike Rother’s book “Toyota Kata.” A kata is a routine or pattern practiced deliberately so it becomes second nature. Toyota Kata specifically has two main routines: the Improvement Kata and the Coaching Kata.
The Improvement Kata is a four-step scientific routine for problem-solving and improvement. The steps are:
1) Understand the Direction or Challenge (set a long-term vision or a challenge that’s a bit beyond current capability);
2) Grasp the Current Condition (really understand where things stand now, with data);
3) Establish the Next Target Condition (a reachable intermediate goal, maybe a few weeks out, that moves toward the challenge);
4) Iterate toward that target condition via experiments (Plan-Do-Check-Act cycles).
It’s essentially applying PDCA in a structured, coached way, where each iteration is a step toward the target condition. The idea is to practice thinking and working like a scientist: run small experiments, learn from them, and adjust.
The Coaching Kata is the routine that leaders or managers use to teach and reinforce the Improvement Kata pattern in their teams. It usually takes the form of a brief daily or frequent interaction (often at a visual storyboard) where the manager asks the learner a standard set of questions about their current condition, target condition, last step, what they learned, and next step. This repetition of Q&A is the “kata” for the coach, and it guides the learner to think scientifically without the coach giving answers away. It also builds the mentor/mentee relationship and continuous learning environment.
Toyota Kata is intended to create a culture of continuous improvement at all levels, not just via expert-led events. By practicing these kata, the habit of approaching challenges methodically and not jumping to solutions is ingrained. Over time, people start doing this naturally even without the storyboard or the formal routine.
You should use Toyota Kata when you want to systematically develop problem-solving skills in the team and tackle challenges that require going beyond current know-how. Instead of just telling someone to improve a metric, the Improvement Kata gives them a way to pursue it step by step.
For example, a manufacturing cell might have a challenge to double productivity in a year (big challenge). The kata approach would have the team (with a coach) set a nearer-term target (maybe increase by 20% in 2 months), then run experiments daily/weekly on things like layout changes, method tweaks, etc, checking results frequently, learning, and iterating. The coach ensures they’re following the pattern, not jumping to conclusions, and that when they hit obstacles, they analyze and try something else.
Toyota Kata is great for beginners because it provides structure. Instead of just saying “go improve,” a new engineer or supervisor has a clear routine to follow and a coach guiding them. It’s also motivating because you get small wins and lessons frequently, rather than a big project that might fail after months.
In summary, Toyota Kata is about creating a continuous improvement mindset through repeated practice of specific routines. It teaches how to improve (the meta-skill of improvement) in addition to what improvements to make. Many companies adopting Lean now incorporate Kata as a way to sustain and deepen their improvement culture, essentially teaching everyone “the way to get better continually” modeled after Toyota’s approach to developing its people.
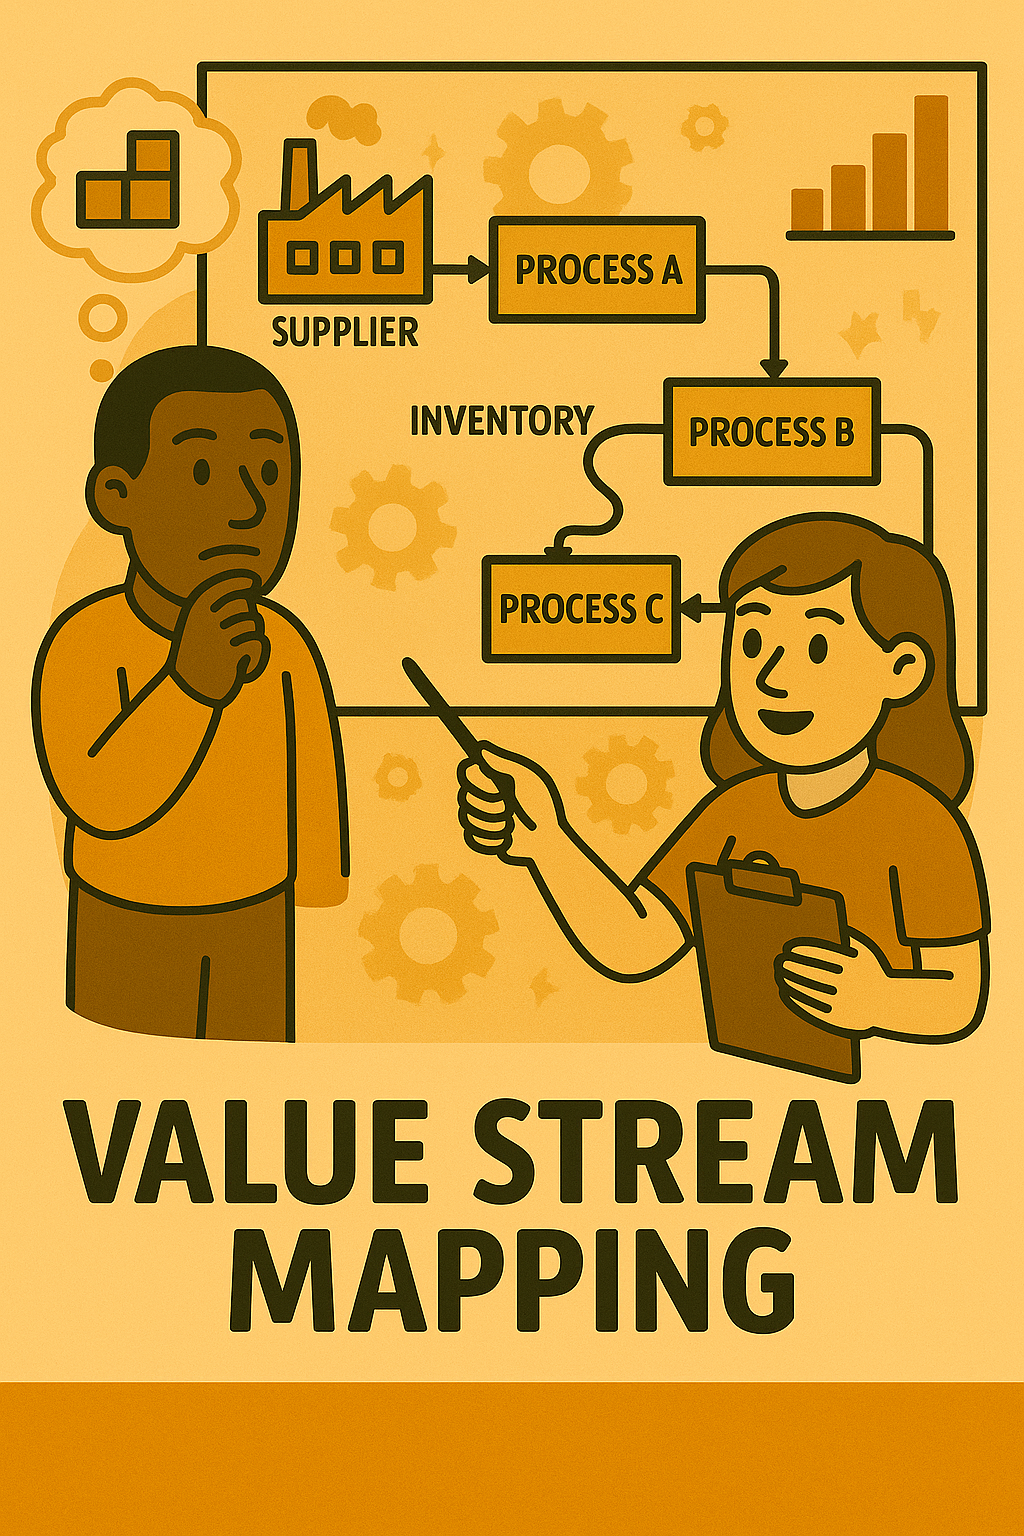
Value Stream Mapping (VSM)
Value Stream Mapping (VSM) is a tool used to visualize and analyze the flow of materials and information required to deliver a product or service to the customer. It’s essentially a high-level flowchart of an entire process (the “value stream”), usually drawn using a standardized set of symbols to represent processes, inventories, transports, information flows, etc. Unlike a basic process map, a VSM also captures key data for each step (like cycle time, changeover time, uptime, yield, etc.) and shows both the current state and, eventually, a designed future state map to improve the flow.
The map is called “value stream” because it helps distinguish which steps add value (from the customer’s perspective) and which are non-value-added but necessary (business value-add) or pure waste. It often spans from raw material or request all the way to the end customer across departmental boundaries.
For example, in a factory, a current state VSM might show raw materials coming in, then a series of production steps, with inventories (WIP stock) stacking up between some steps, and maybe delays like wait for batch transport. It will also show the information flow, like a monthly production schedule released to the first department, or manual orders triggering something. At the bottom, a timeline is typically drawn to sum up the total processing time versus waiting time. Commonly you find that total lead time is, say, 20 days whereas actual work time is 2 minutes, revealing huge waste in waiting/inventory.
By analyzing this, a team identifies improvements for a future state (like implement pull system with Kanban instead of push schedule, reduce batch sizes, streamline some steps, eliminate some rework loop, etc.). They then draw a future state map which is the goal scenario. Achieving that future state might require multiple kaizen projects.
Value Stream Mapping should be used at the start of Lean transformations to see the big picture and choose where to focus, and it can also be used at a smaller scale within departments. It’s a great communication tool too, it makes it easier to explain to others how work actually flows and where the problems are (since it’s visual).
For beginners, doing a VSM is enlightening. It forces you to go out and gather real data (how long things actually take, how many are waiting, etc.), not just rely on assumptions. It also encourages cross-functional collaboration because you have to talk to people in each part of the stream.
One common result of a VSM exercise is discovering that a lot of time is spent in “white spaces” between processes (hand-offs, waiting for approvals, etc.), not in the processes themselves. So it guides you to solutions like better scheduling, combining steps, cutting out hand-offs, etc. It also directly supports implementing pull systems and better balancing.
In summary, Value Stream Mapping is a visual mapping technique to understand the current process flow and design a better flow by focusing on value-adding steps and eliminating waste. It provides a clear before-and-after vision (current vs future map) which can rally teams to make changes and is a cornerstone of Lean planning.
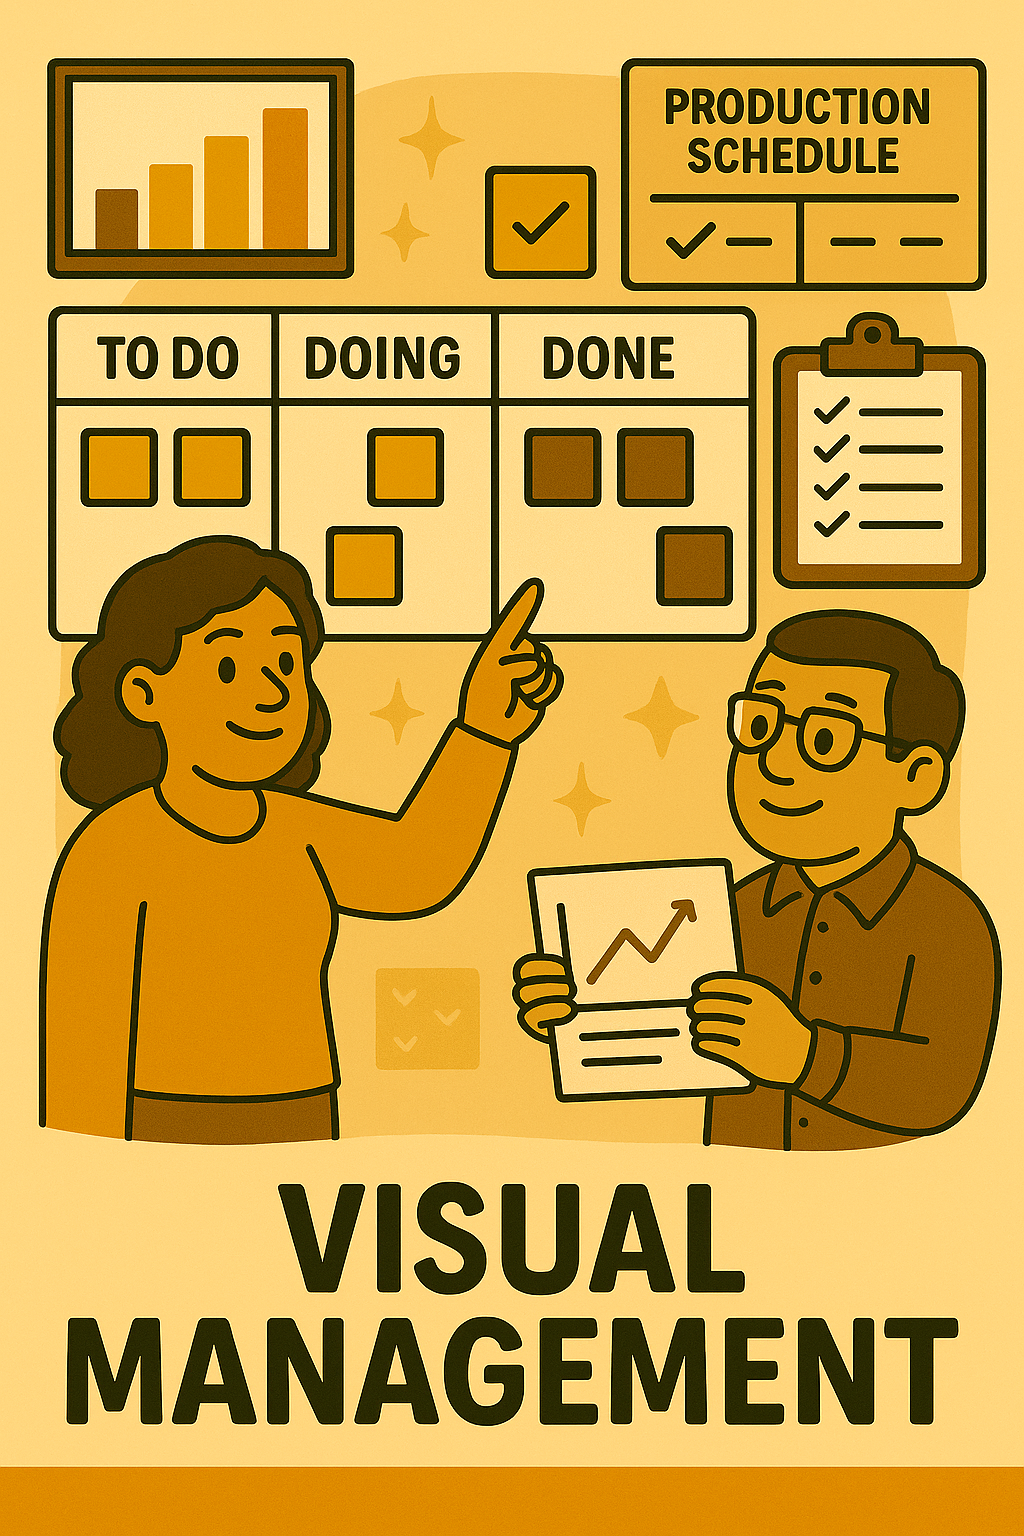
Visual Management (Visual Controls)
Visual Management refers to the use of visual signals, displays, and controls to communicate important information at a glance, making the state of operations obvious to everyone, so you can manage with your eyes. In a well-implemented visual management system, anyone (even someone unfamiliar with the process) can walk through the area and quickly see what’s going on, whether things are normal or abnormal, and where attention is needed. It moves critical information out of obscure reports and into the workplace environment itself.
Examples abound: color-coded status lights (Andon boards) indicating if a machine or line is running (green), needs assistance (yellow), or stopped due to a problem (red). Production control boards showing for each hour how many units should be made vs actually made, so if behind schedule it’s visible. Floor markings outlining work areas, tool shadows on a shadow board, Kanban cards visibly attached to parts containers, all these cue people on what to do or not do without a supervisor’s verbal instructions. Another example: a thermometer-like gauge on a team’s KPI (like an arrow pointing to green zone if on target, red if not). Visual controls can also include things like standard work posted at the station, showing the correct method in pictures.
The idea is that visuals trigger the right behavior or response. If a bin is in the red zone (empty) and a Kanban card is visible, it signals production to replenish. If a machine has a big red tag on it, that’s a visual control telling everyone “don’t use this, it’s under maintenance” so no lengthy memo needed.
5S is a foundation for visual management, because a clean, well-organized space makes abnormalities stand out (if a tool is missing, the empty shadow is visual proof; if there’s a leak, you notice it on a shiny clean floor).
You should implement visual management so that workers can self-manage and teams can collaborate without a lot of bureaucracy. It shortens reaction times, problems are seen when or before they occur, not after a long delay. It also reinforces standards (for example, a gauge with a green zone and red zone is a visual standard; if the needle goes to red, that’s a call to action).
For beginners, a fun way to think about it: Imagine you couldn’t talk or read in a process area, would you still know what to do and what’s happening? Good visual controls make that possible. It reduces reliance on memory or complex training because the environment “talks” to you.
A classic lean saying is “Visual controls = Visual accountability.” If, for instance, each team has a public board of their metrics and actions, it’s clear how they are doing and what they’re working on. That transparency often drives engagement and responsibility, nobody wants their line to be the one constantly showing red lights; it motivates solving the issues.
Examples: supermarkets use visual management in simple ways (shelves are designed so front is always filled, if it’s not, it visually signals restock needed). Airports use it (different colored lanes, signage, blinking lights on something needing attention). In offices, think of color-coded file folders or dashboards with stoplight indicators.
In summary, Visual Management or Visual Controls are about making important information visible and intuitive in real time. They help maintain the process (when all is good, visuals confirm it) and highlight problems (when something’s off, visuals alert everyone). It’s a key part of Lean’s aim to empower workers and make problems obvious (so they can be fixed), rather than hidden or ignored.

Voice of the Customer (VOC)
Voice of the Customer (VOC) is a term that describes the process of capturing customers’ expectations, preferences, and aversions, essentially learning what customers truly value and need. It’s critical because Lean (and Six Sigma and really any good business practice) starts with understanding value from the customer’s perspective. If you don’t know what the customer cares about, you might improve the wrong things.
VOC activities can include surveys, interviews, focus groups, direct customer observations, feedback analysis, social media monitoring, warranty data analysis, any method to gather input on customer wants and experiences. The output of VOC is usually a set of customer needs or CTQs (Critical to Quality attributes), often phrased in the customer’s own words (e.g. “I need the delivery to be fast,” or “I want the software interface to be intuitive”), which then need translation into measurable requirements (like “delivery within 2 days” or “user can accomplish key task in 3 clicks”).
For example, in a VOC effort for a car, customers might voice things like “I want better fuel efficiency,” “It should be safe for my family,” “The sound system should be high quality,” etc. These are then taken into product design targets. In service industries, VOC might reveal pain points such as “It takes too long to get a service rep on the phone” or “The billing statements are confusing.”
You should gather VOC at the start of any improvement project to ensure you align your efforts with what customers actually want. For instance, a process team might think speed is the main issue, but VOC might reveal that customers are more concerned about accuracy or about being kept informed during the process. That insight would shape what solutions you pursue.
A beginner might do VOC by simply calling a few customers and asking open-ended questions about how they find the service/product and what could be better. More formally, one could create a survey with specific questions or host a user group meeting.
Lean often uses VOC in conjunction with tools like QFD (Quality Function Deployment) to systematically convert voices into design specs. Six Sigma projects also start with VOC to define CTQs.
The importance of VOC is summed up by “value is what the customer says it is.” It prevents inward-focused thinking. It might also highlight opportunities for innovation, as sometimes customers articulate problems that could be solved in new ways.
One challenge is sometimes customers only voice solutions (“I want a faster horse,” said folks before cars were a thing). So interpreting VOC needs some skill, understand the underlying need (mobility) versus the literal ask. Still, starting with listening is key.
In Lean improvements, say you’re streamlining an order process, VOC could be the step of calling a few customers to ask about their experience ordering. They might say, “I never got order confirmations and that worried me,” or “I love that your website is simple.” Those comments guide you to keep what they love (simplicity) and fix what they don’t (lack of confirmation emails).
In summary, Voice of the Customer is the collective insight into customer’s likes, dislikes, needs, and desires regarding your offerings. It’s gathered through various means and used to ensure the focus of improvement or design efforts is on delivering what truly matters to the customer. It keeps Lean projects from just cutting waste in a vacuum and instead cutting the right waste that improves customer satisfaction.
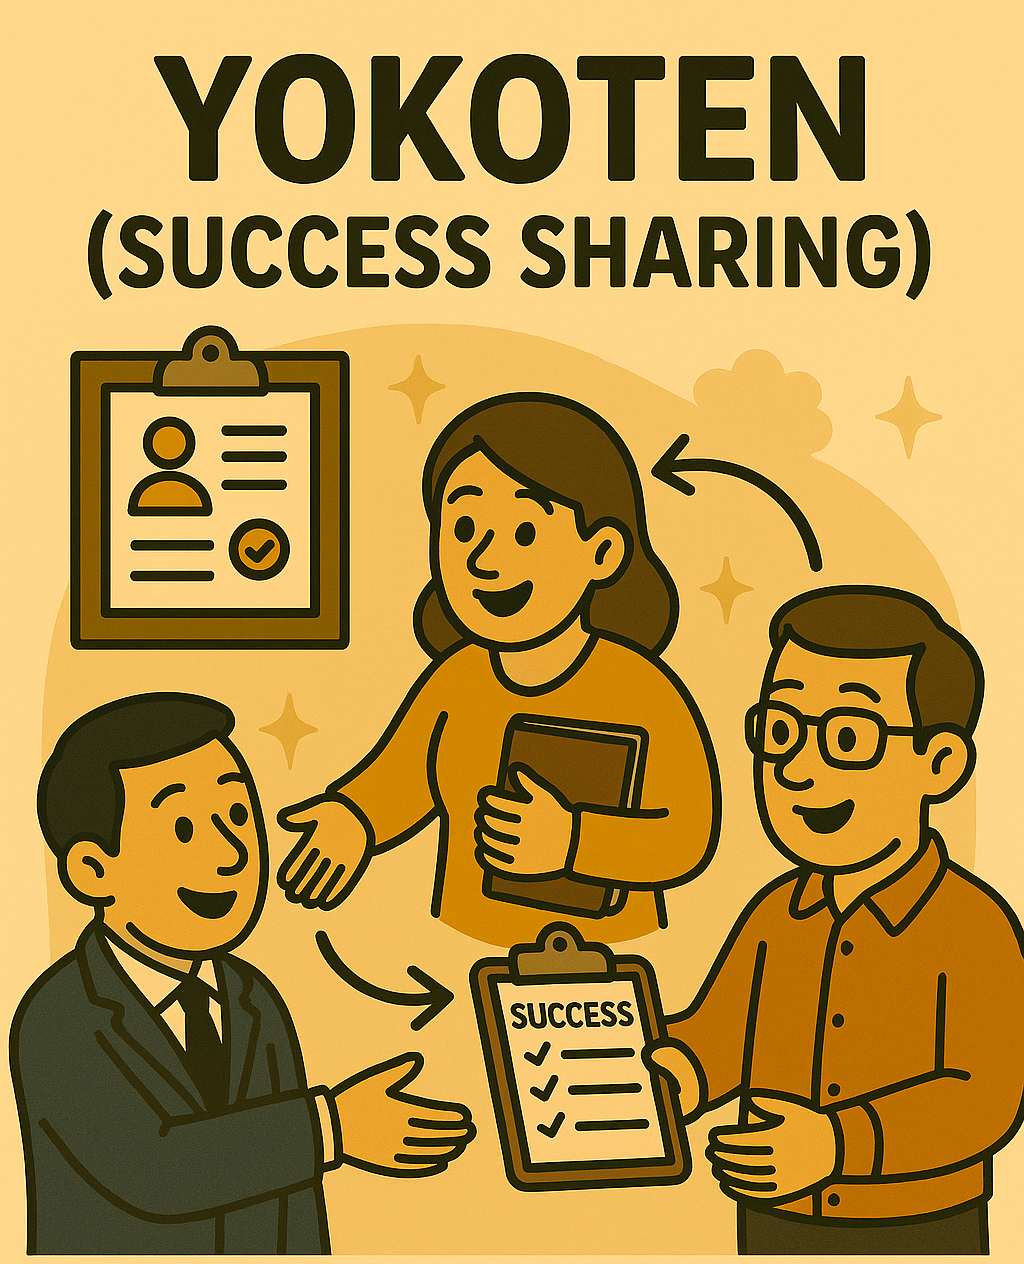
Yokoten (Success Sharing)
Yokoten is a Japanese Lean term that means “horizontal deployment” or knowledge sharing across the organization, particularly replicating good results and best practices from one area to others. In simpler terms, if one team or plant comes up with a great improvement, Yokoten is the practice of sharing that idea with peers in other teams or plants so they can consider adopting or adapting it. It’s Lean’s way of avoiding “reinventing the wheel” in each silo and instead leveraging collective learning.
For example, if a factory A reduced changeover time with a clever new fixture design, Yokoten would be sending that info to other factories or departments running similar processes, maybe through a report, a presentation, or best a visit to show them (seeing is believing). Then those other groups can implement the same or improved version if applicable. It’s not a top-down mandate like “we must all do exactly what A did,” but more “here’s a proven concept, check if it fits your situation and try it.” It encourages lateral learning rather than isolated improvements.
In a Lean culture, Yokoten happens as part of routines, maybe during monthly Lean leader meetings, each shares their improvements, and noteworthy ones are documented and circulated. Or via internal newsletters or database of kaizens.
It’s related to creating a learning organization. Toyota, for instance, is known to share improvements across plants worldwide; managers visit each other’s operations to observe and take back ideas. It’s part of why they continually improve as an entire company, not just one star plant and others lagging.
You should use Yokoten whenever you have multiple similar operations or teams. When one solves a problem or makes a significant improvement, actively spread that knowledge. It saves time (others don’t have to solve the same problem from scratch) and helps standardize to better practices. It’s like the Lean equivalent of open-source culture, improvements are not guarded as “our department’s secret,” but are given away for overall benefit.
A caution: Lean thinkers stress, Yokoten is not copy-paste blindly. It’s “learn from it and apply appropriately.” Different context might need tweaking the idea. Also, ensure the original idea is truly a good practice (confirmed by data and stability) before mass sharing.
For beginners, practicing Yokoten might be as simple as at the end of a successful project, writing up a one-page summary and emailing it to colleagues in other areas. Or inviting peers from other lines to come see the improvement in action. Many companies have internal Lean networks or platforms exactly for this.
Culturally, Yokoten breaks down the “not invented here” syndrome. It fosters an environment where it’s expected to look outside your immediate team for ideas and to generously share your own. Sometimes companies incentivize it, like an improvement isn’t fully celebrated until it’s been yokoten’ed to at least two other places.
In summary, Yokoten is the lateral sharing of best practices and learnings across an organization to replicate success and accelerate improvement everywhere. It’s how an organization compounds improvements rather than keeping them isolated. Think of it as copying homework, but in a good way, copying the answers that someone legitimately figured out to help everyone ace the test (with understanding, not rote). It turns local improvements into global ones, driving the whole organization forward.